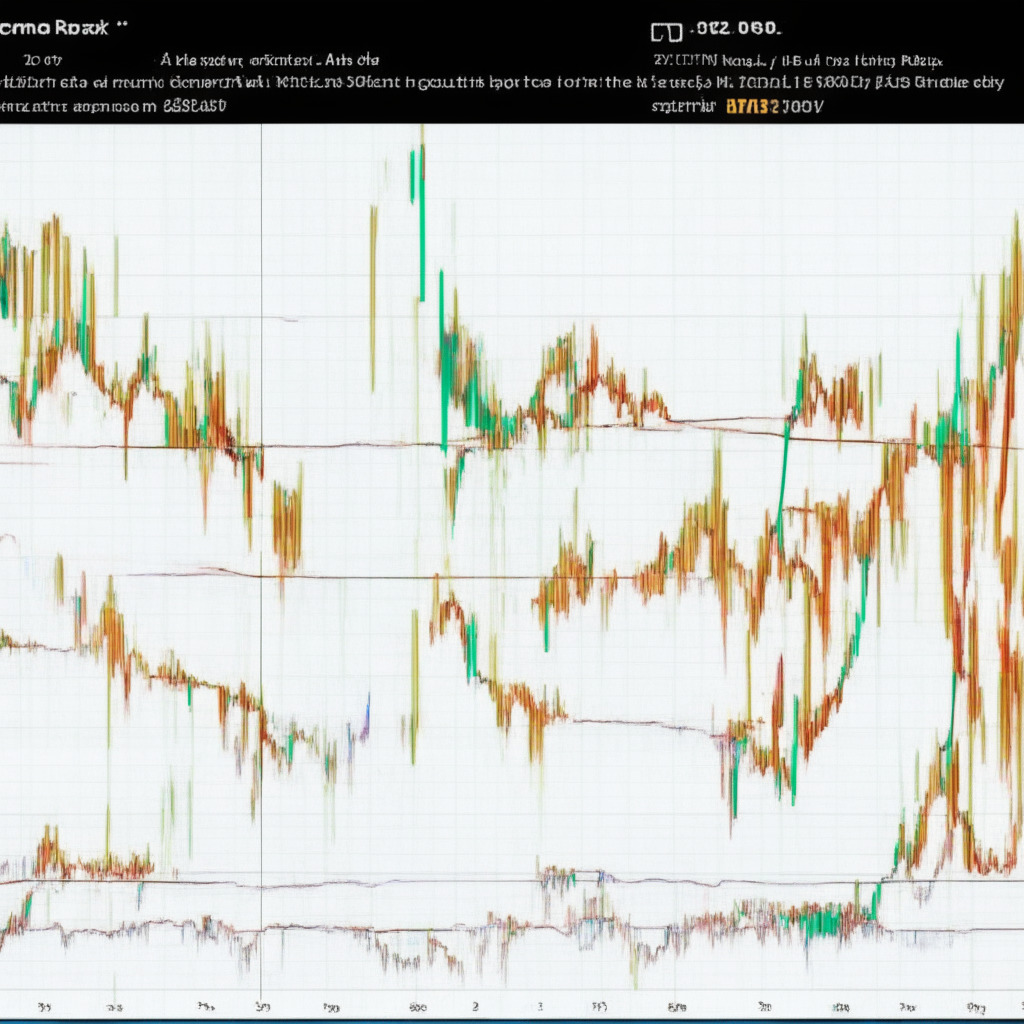
In the midst of a highly volatile market, Terra Classic‘s LUNC cryptocurrency maintained a sideways trend over the past two weeks. The daily chart reveals that this consolidation was limited to two converging trendlines, creating an inverted pennant pattern. Widely recognized for being a bearish continuation pattern, the completion of an inverted pennant often results in extended downtrends.
Adding to the ongoing discussions around Terra Classic, Binance CEO recently expressed support for raising LUNC’s burn tax to 0.5%. In the meantime, LUNC’s daily trading volume increased by 37%, reaching $21.5 million.
Today saw a significant outflow of LUNC, resulting in a loss of 6.38%. The substantial decline from the support trendline of the pennant pattern signals that sellers are reclaiming control. As the support trendline flips into potential resistance, sellers are presented with additional opportunities to exert pressure on buyers.
Based on the pennant breakdown, it’s expected that LUNC’s price could plummet by 20% to reach the psychological support level of $0.00007. However, if a breakout from the long-standing resistance trendline occurs, the bearish outlook may be invalidated.
The completion of the bearish pennant pattern sets LUNC’s price on a course for a potential downturn. If the coin’s price sustains below the breached trendline, values are likely to test the $0.00008 support level, potentially resulting in further declines.
From a technical standpoint, the 20-day exponential moving average (EMA) is currently following a downward trajectory, suggesting dynamic resistance that supports sellers’ intentions to push LUNC’s price lower. Meanwhile, the widening distance between the DI- (orange) and DI+ (blue) indicators in a bearish alignment reflects an active bearish trend.
It’s important to bear in mind that the content presented here represents personal opinions and analysis, and market conditions are subject to change. As always, be sure to conduct thorough research before investing in cryptocurrencies. Neither the author nor the publication holds any responsibility for personal financial loss.
Source: Coingape


