Amid the recent sell-off in the crypto market, the Ethereum price witnessed a minor pullback which retested the breached trendline of the wedge pattern. This retest is meant to check price sustainability at a higher level and validate whether the buyers are ready to make further growth. Interestingly, the bullish candle pattern called morning star offered at the bottom of this retest project the buyers are defending the reclaimed support.
The wedge pattern breakout signals an early sign of the end of the correction phase and the start of a new recovery rally. A potential uptick in the daily ADX indicator (black) will reflect the buyer’s strength for carrying the sustained rally. The intraday trading volume in Ether is $6.1 Billion, indicating a 6% gain.
Currently, the Ethereum price exchanges hands at $1894, with an intraday gain of 1.69%. This price jump shows the formation of a morning star candle at the recently breached trendline, indicating the market sentiment shifted from selling on bounces to buying on dips. As a result, the increased accumulation from buyers could assist the Ethereum price in reclaiming lost ground and carrying a sustained rally.
The altcoin is likely to rise 6.5% to hit the first significant supply zone of $2000, followed by the same growth potential to reach $2135. However, if the ETH price showed no significant movement in the coming days, it would indicate some weakness in buying momentum, and therefore increase the possibility of invalidating the bullish thesis.
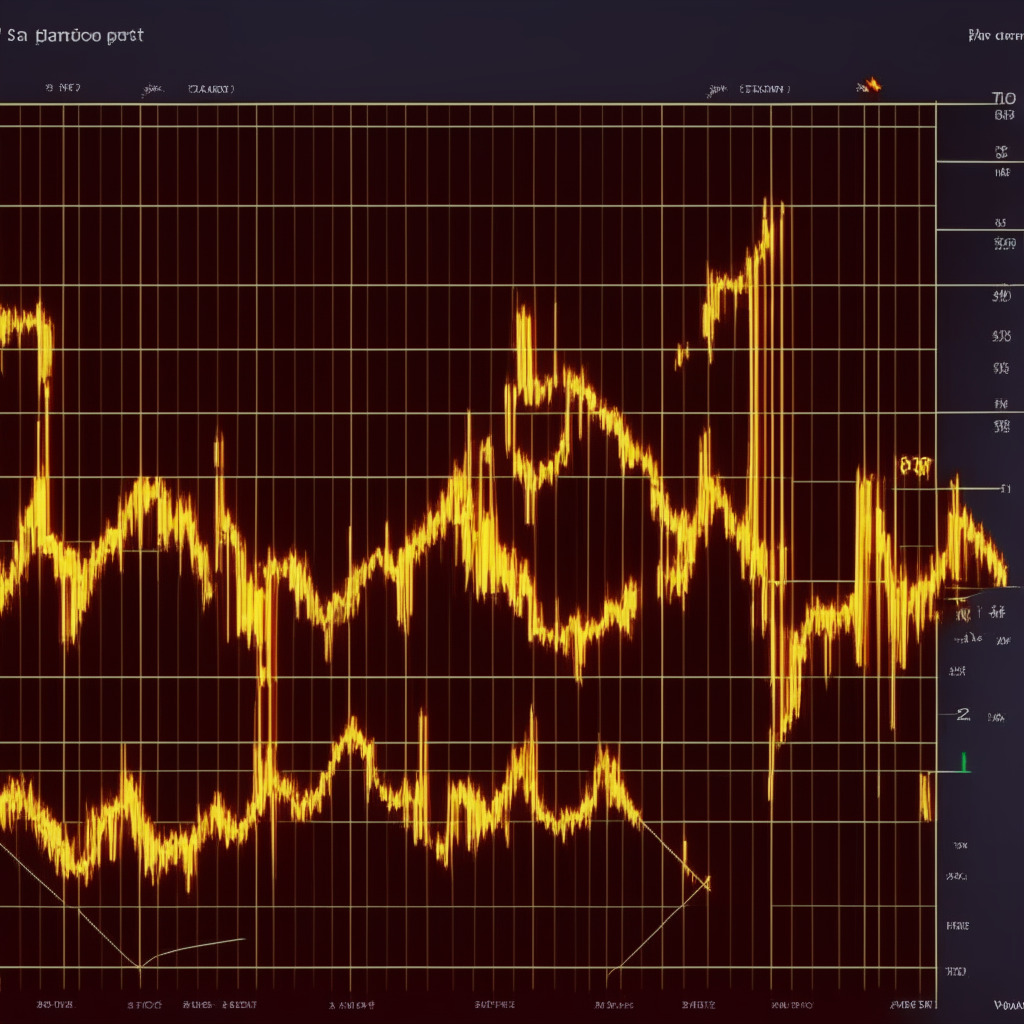
The wedge pattern breakout has set the Ethereum price on a significant upswing in the daily chart. With sustained buying, the nearest supply zone for the altcoin is the $2000 mark. Traders must remain cautious at this supply zone, as sellers could recuperate to change the trend direction.
The Directional Movement Index reveals a positive crossover between the DI+ (blue) and DI- (orange) slopes, reflecting a positive trend in the market. Meanwhile, the Exponential Moving Averages (EMAs) in the daily time frame chart showcase the 20 and 50 EMAs providing strong pullback support while the 100 EMAs offer a suitable footing during long corrections.
Despite the optimistic outlook, the market remains unpredictable, and investors should keep an eye on the various factors driving the Ethereum price. Always be cautious and conduct thorough research before diving into any crypto investment. After all, the author or publication does not hold any responsibility for personal financial loss.
Source: Coingape