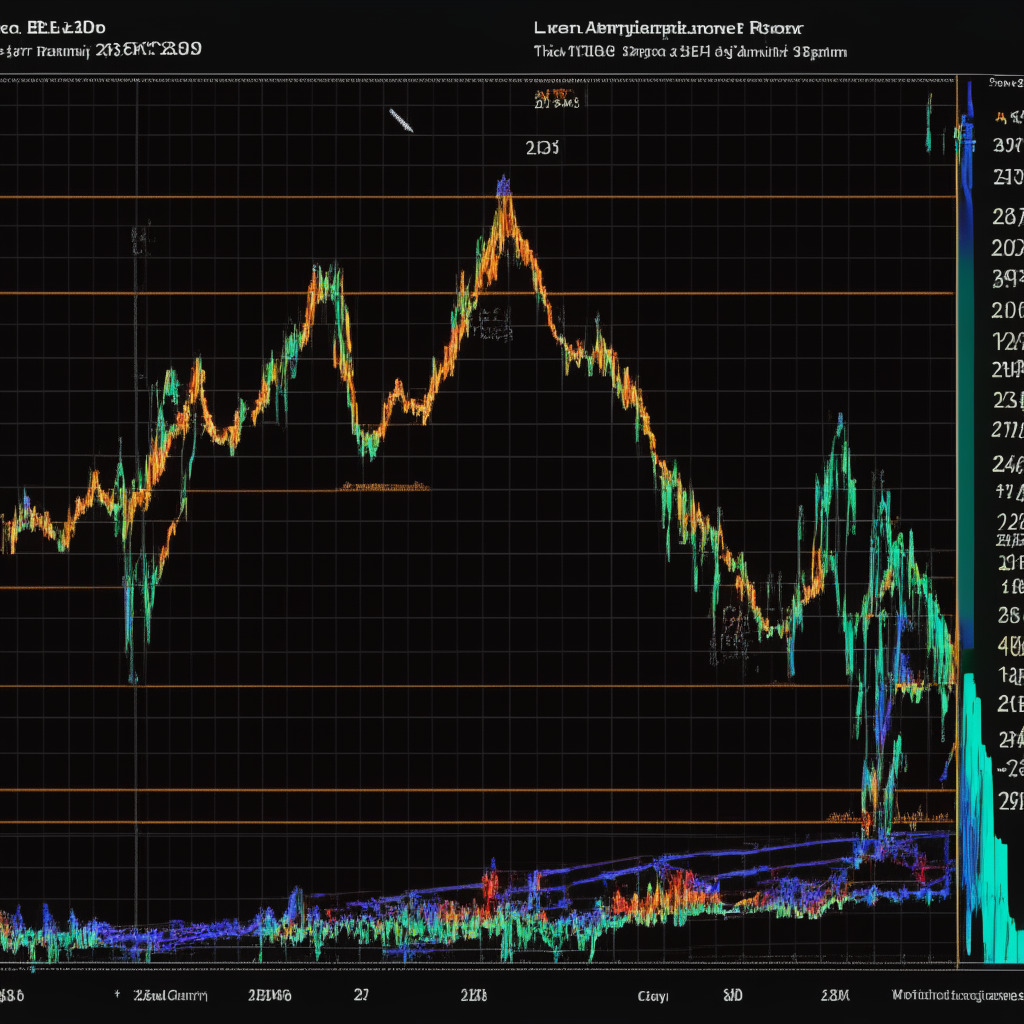
On June 2nd, the Ethereum price formed a bullish morning star candle at a recently breached resistance trendline, suggesting that buyers are sustaining at higher chart levels. This trendline, which previously acted as a dynamic resistance, now offers suitable support, hinting at a shift in market sentiment from selling on rallies to buying on dips. With this potential recovery in the Ethereum price, can we expect it to reach $2,000?
Bitcoin and Ethereum have both witnessed recoveries recently, possibly due to the US debt ceiling deal, the Federal Reserve pause, and an easing jobs market. The Ethereum fear and greed index stands at 56%, which reflects market sentiment supporting a bullish recovery. However, the rising Ethereum price may encounter a minor hurdle at $1,922, aligned with the 23.6% Fibonacci extension level. Interestingly, the intraday trading volume in Ether has increased by 31%, reaching $4.2 billion.
A bullish breakout from the wedge pattern has set the Ethereum price on a path to recovery. As of press time, the coin’s price trades at $1,904, with a relatively insignificant intraday loss of 0.18%. If bullish momentum continues, the Ethereum price could rise to levels between $2,020 and $2,120, which are combined with the 32.8% and 50% Fibonacci extension levels. This technical tool helps traders identify potential price targets or areas of interest in a trending market.
While a successful flip above $2,120 might suggest the resumption of the prevailing recovery rally and push the Ethereum price to $2,500 (100% Fibonacci retracement), it’s crucial to note the recent correction’s length. To reach the $2,500 mark, Ethereum would need a 30% rally, which is less likely to happen this month, considering the current market sentiment’s uncertainty. However, the mentioned target may be achieved gradually. Coin holders should closely monitor the hurdles at $1,920, $2,020, $2,138, and $2,340. A breakout beyond these barriers could present a new entry opportunity for interested traders.
The daily Relative Strength Index (RSI) slope stands at 57%. An aggressive bullish confirmation could be achieved if the RSI breaches the 60% after wavering lower for the past six weeks. On the other hand, a breakdown below the dynamic support of the 20-day and 50-day Exponential Moving Averages (EMAs) would signal the invalidation of the bullish thesis mentioned above.
In conclusion, while there are indications of a potential recovery in Ethereum’s price, uncertainty remains, especially considering the required 30% rally to hit the $2,500 mark. Market participants should closely monitor key support and resistance levels and be prepared for both bullish and bearish outcomes.
Source: Coingape


