Defying the increasing selling pressure in the crypto market, Bitcoin has moved sideways over the past two weeks. The daily chart showcasing multiple Doji candles indicates no initiation from buyers or sellers to take trend control. Amid this consolidation, Bitcoin’s price is being respected by two converging trendlines, suggesting the formation of a symmetrical triangle pattern.
The formation of the triangle pattern implies that Bitcoin’s price is currently stuck in a no-trading zone. To initiate a bullish recovery, a breakout from this wedge pattern is needed. The intraday trading volume in Bitcoin is $8.93 billion, indicating a 38% loss.
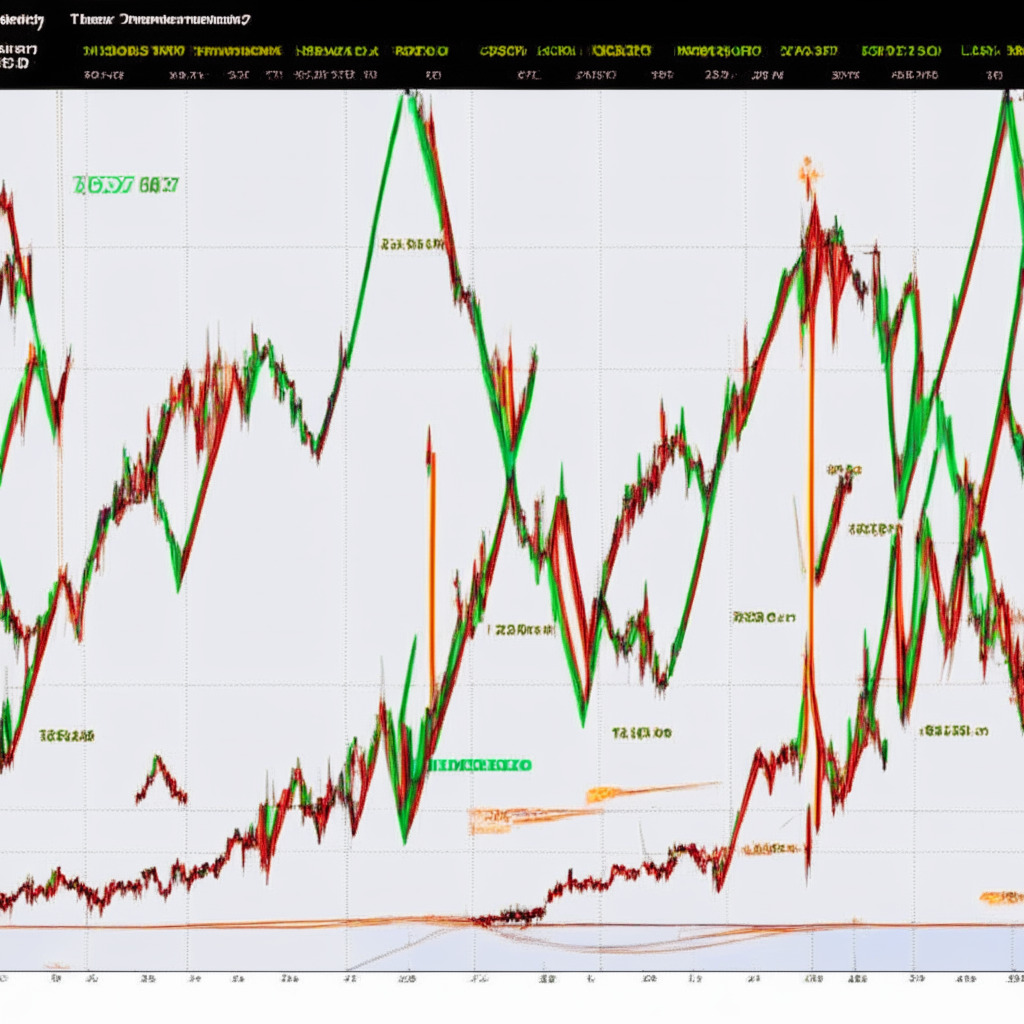
Within the 4-hour timeframe chart, Bitcoin’s price shows the formation of a symmetrical triangle pattern. This chart setup is a well-known continuation pattern that carries forward the prior trend momentum upon the breakout of the trendline barrier. At the time of writing, Bitcoin is trading at $26,095 with a minimal gain of $0.15. While the short-term trend remains bearish, the price is likely to break below the bottom trendline of the pattern, intensifying selling pressure.
A potential breakout below the trendline will increase selling pressure and push the BTC price back to the combined support level of $25,000 or the support trendline of the falling wedge pattern. Conversely, a bullish breakout from the triangle pattern will invalidate the bearish thesis. For Bitcoin’s price to reach $27,000 in the coming weeks, it needs to break out from the resistance trendline of the triangle pattern. This breakout will provide buyers with a significant opportunity to push prices 3.6% higher. Additionally, a breakout above the wedge pattern will trigger a significant recovery in Bitcoin’s price.
Contrary to the sideways action, there has been notable growth in the daily Relative Strength Index (RSI) slope, indicating underlying bullish momentum and suggesting a plausible breakout from the triangle pattern. This divergence in the RSI sends mixed signals to market participants, who are eagerly waiting for a definite trend direction.
The Bollinger Bands’ contraction reflects market uncertainty and the need for a significant breakout to establish a new trend. In the coming weeks, whichever direction Bitcoin’s price takes upon breaking out of the symmetrical triangle pattern, traders and investors should brace themselves for a potentially volatile market scenario.
In conclusion, both bullish and bearish outcomes have valid arguments, making it crucial for market participants to keep an eye on the symmetrical triangle pattern and the critical levels discussed. No matter the outcome, opportunities for significant price movements could arise, allowing both buyers and sellers to benefit from strategic trading decisions. However, it is essential to conduct thorough market research and analyze market conditions before investing in cryptocurrencies, as financial risk always accompanies these ventures.
Source: Coingape