On June 10th, the Binance coin price experienced a decisive breakout from the support trendline of a triangle pattern that had persisted in a sideways trend for almost a year. This breakdown appears to have unleashed trapped bearish momentum, potentially setting BNB on a path for a prolonged downturn. In principle, each swing low formed during the triangle formation could act as an important target for traders. Notably, Binance’s BNB Chain is on the verge of announcing a layer 2 blockchain solution.
Examining the Binance price daily chart, the $200 mark has emerged as a high-demand zone for BNB buyers. A bearish crossover between the 100-and-200-day EMA might trigger additional sell orders in the market. As of now, the intraday trading volume in the BNB coin is $389.5 million, signifying an 11.2% loss.
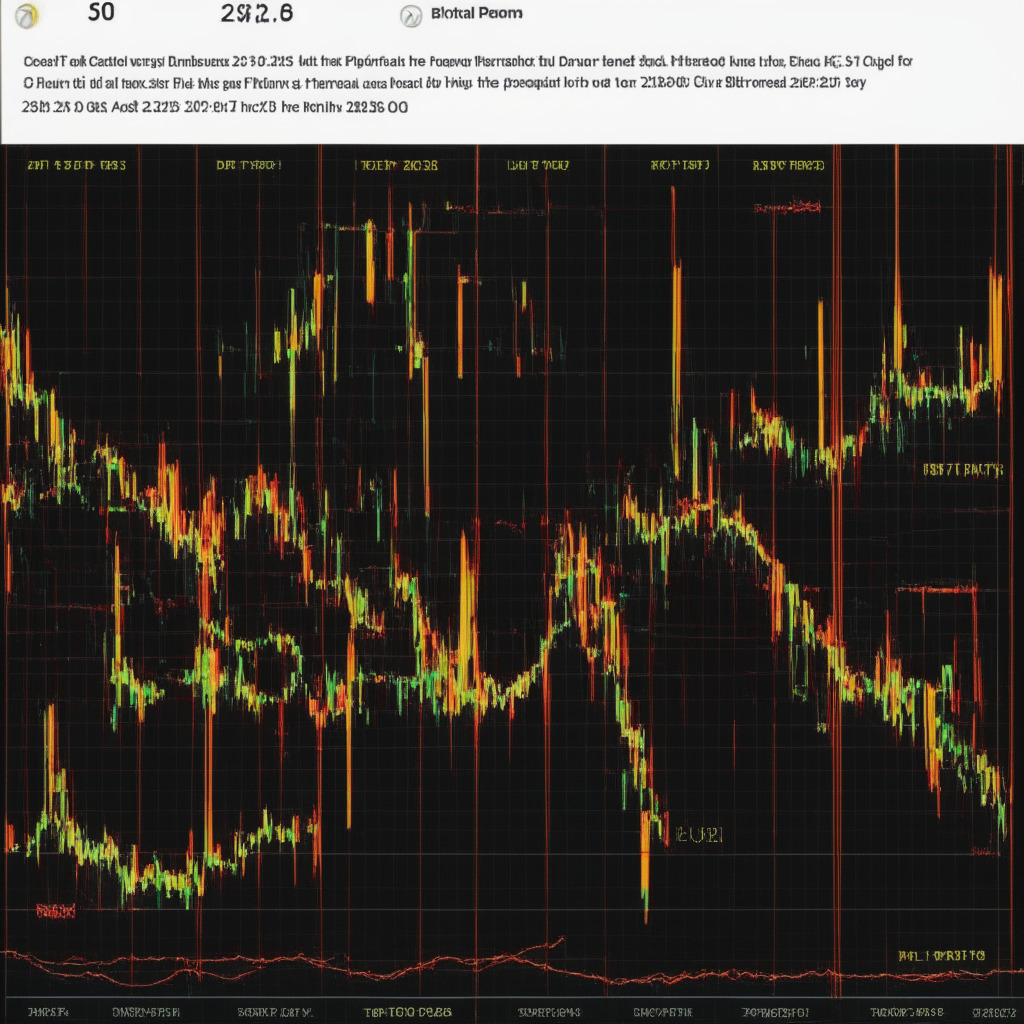
Earlier this week, the BNB price experienced a minor pullback in its ongoing downtrend and retested the breached trendline for possible resistance. A long-wick rejection candle formed at the flipped resistance suggests a shift in market sentiment toward perpetuating the downward trend.
From the retest point of $253.5, the coin price plummeted by 7.85% to reach the current price of $234 mark. With robust selling momentum, sellers are likely to drive the price down another 6% to reach the $220 mark – a level representing multi-month support. This support could factor into delaying the potential fall and allowing the BNB price to hover sideways for a brief period.
A pessimistic scenario could see a breakdown below $220, which would likely cause the price to plummet to the psychologically significant support level of $200. The completion of the symmetrical triangle pattern with a bearish trajectory implies a substantial downfall for BNB’s price. The reject retest phase confirms increased selling pressure, suggesting that the price might plunge to $220 and then to $200. However, further drops from these levels may be less probable in order to maintain stability in this altcoin.
The Vortex Indicator displays a wide gap between the VI+ and VI- slope in a bearish alignment (VI->VI+), signifying that the overall market trend remains bearish. Similarly, the Exponential Moving Average (EMA) under aggressive bearish momentum shows that the 20-day EMA could act as dynamic resistance to extend the downward trend.
Investors should exercise caution and perform their market research before investing in cryptocurrencies, as the presented content may include personal opinions subject to market conditions. The author, as well as the publication, does not hold any responsibility for personal financial loss.
Source: Coingape