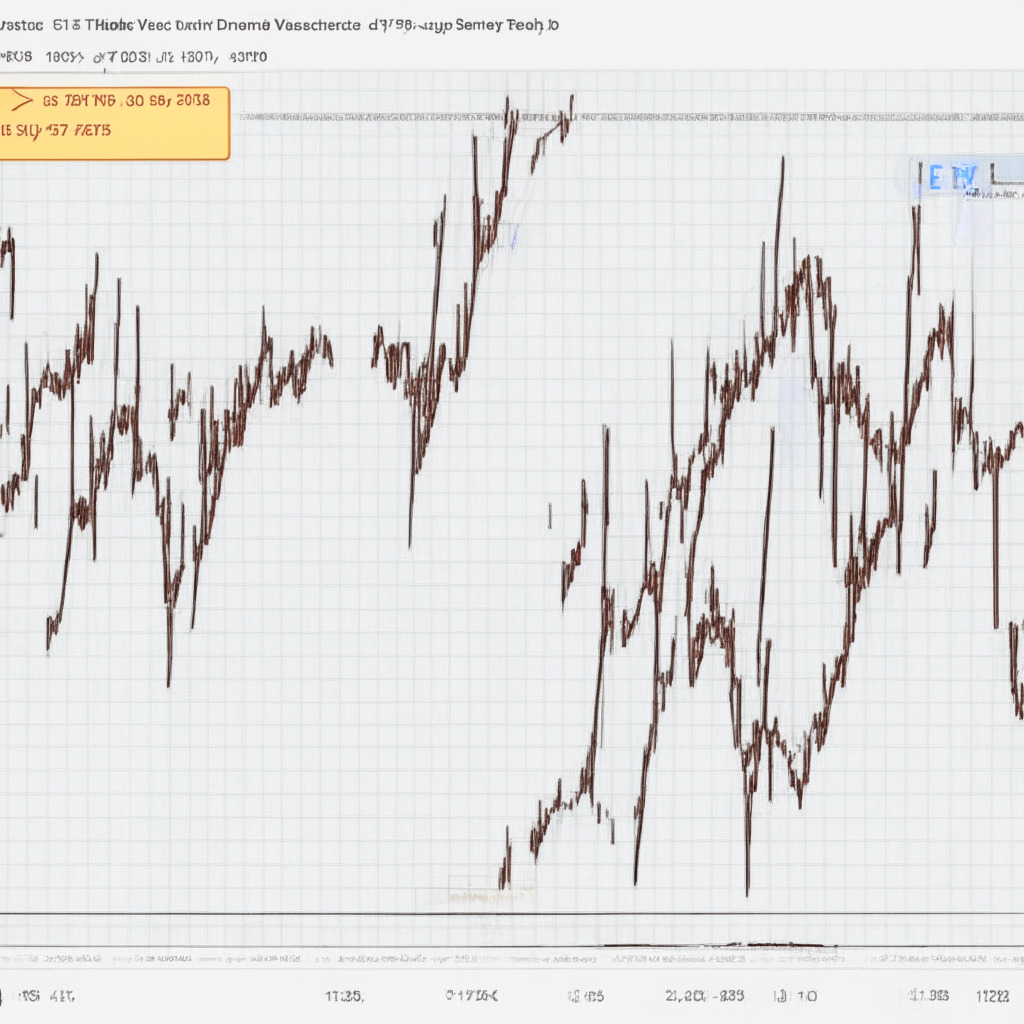
After a substantial decline in the second week of June, the Ethereum price managed to find support at a rising trend line. Investors were drawn to the reduced price, causing a surge in purchasing pressure resulting in an 8.3% price increase, reaching a resistance of $1770. So, is ETH ready to recover?
ETH’s price wavered between $1775 and the ascending trendline in a no-trading range. The current correction in the coin is attributable to a downward-sloping trendline. The intraday trading volume in Ether is $5.8 billion, with a 37.5% loss.
Over the last three days, ETH’s recovery faced strong selling pressure at the $1775 resistance. This long-tail rejection candle on June 17th demonstrates that sellers continue to have control over the market, making it more challenging for buyers to advance.
However, with the increasing buying pressure due to the discounted price combined with the overall downtrend, we might anticipate a volatile week ahead for the ETH price. Currently trading at $1731, it could continue to oscillate between the ascending trendline and the $1775 resistance. Potential buyers are advised to wait for a breakout above these thresholds to obtain further confirmation of a possible rally. If a breakout occurs, prices could rise to $1930, followed by $2020, and then $2138. Ethereum buyers should maintain their long positions as long as the long-coming support trendline remains in place.
Simultaneously, a bearish breakdown below this support trendline would grant sellers the power to push the price downwards. Such a breakdown would signal a trend change that could potentially cause prices to fall to the next significant support level of $1375.
The Moving Average Convergence/Divergence (MACD) reflects the building buying pressure at lower levels due to an uptick in the MACD slope (blue line). Meanwhile, the Bollinger Band’s lower band facing downward suggests that selling momentum is still active and that prices may struggle to make a rapid recovery.
As we have seen, the ETH price appears to be balancing both positive and negative trends, resulting in a potentially volatile week ahead. Therefore, investors should closely observe these market developments and conduct thorough research before investing in cryptocurrencies. The author or publication holds no responsibility for personal financial losses.
Source: Coingape


