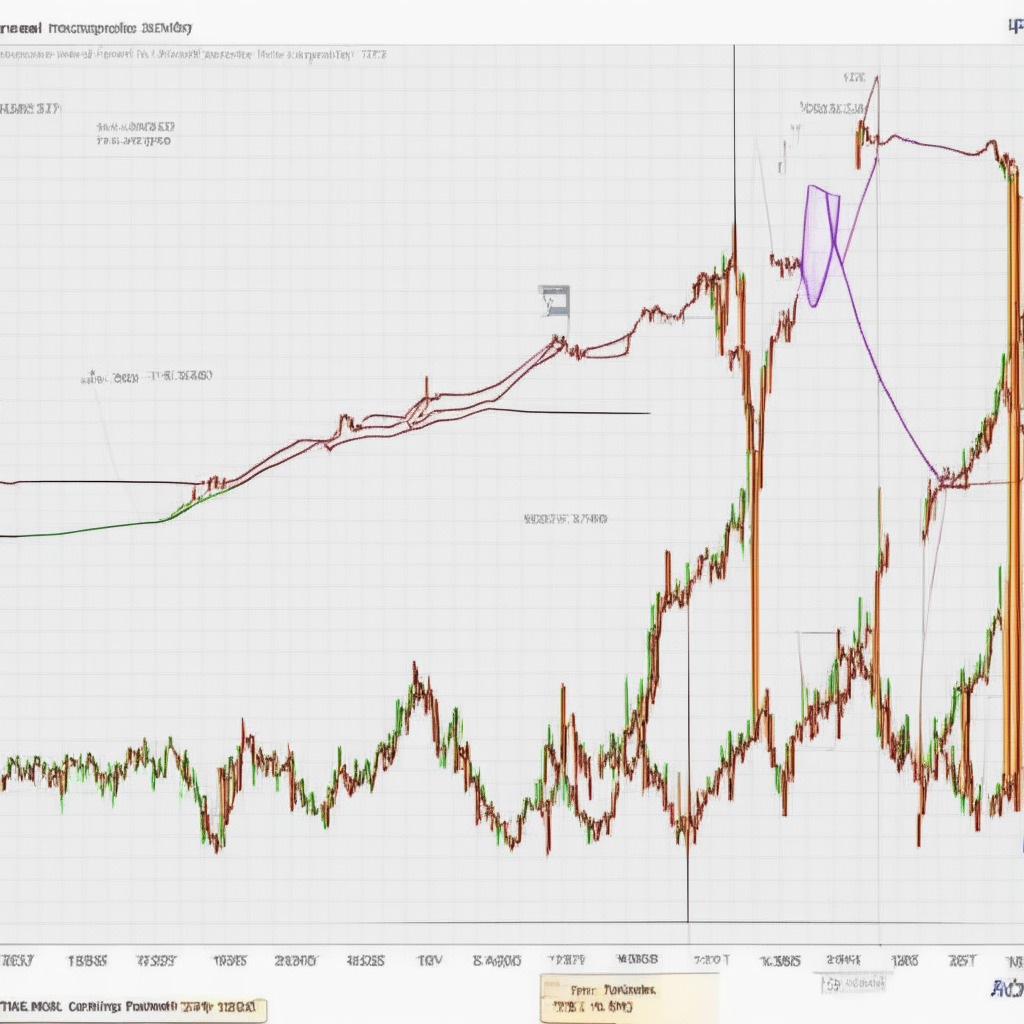
On June 15th, the Ethereum price encountered a crucial support level at an ascending trendline (blue) and ignited a relief rally, resulting in an 8.5% surge within a mere three days. The coin price reached an immediate resistance zone of $1775-$1765; however, the selling pressure at this barrier appears to have halted the rising momentum. This might indicate that Ethereum may experience slight consolidation before launching into a significant recovery rally. JPMorgan recently backed a speech on Ethereum, although some crypto experts disagreed with this stance.
In analyzing the Ethereum price daily chart, it becomes apparent that sellers actively defend the price range of $1775-$1765, as shown by the higher price rejection candles. A breakdown below the support trendline might provoke a powerful correction in Ethereum’s value. The coin’s intraday trading volume sits at $5.7 billion, marking a 57.5% gain.
Over the past four days, Ethereum’s price has been moving sideways, remaining below the resistance of $1775-$1765. The daily candle illustrates short-bodied candles and relatively longer rejection wicks on the upside, suggesting that overhead supply pressure exists. This resistance is pushing buyers into a potential temporary sideways trend, as they struggle to leverage the market.
However, amidst this potential consolidation, a retest of the lower trendline might lure more buyers interested in purchasing at lower prices. To achieve a sustained recovery rally, though, buyers must initially breach the $1775 mark and the downsloping trendline. A successful breakout could signal a resurgence of bullish momentum and present traders with long opportunities, targeting $1926, $2020, or $2130 levels.
Currently, Ethereum’s price remains in a correction phase due to the influence of a resistance trendline (red). Given the prevailing market uncertainty, the coin price might continue sideways below the $1775 level before attempting a rise. Nevertheless, a breakout above the trendline could display signs of significant recovery.
As for the Directional Movement Index, the positive crossover between the DI+ and DI- indicates diminishing bearish momentum. Simultaneously, the daily Exponential Moving Averages (EMAs) for 20, 50, and 100 days converge near the $1775 barrier, creating a high supply zone for traders.
In conclusion, the presented content represents personal opinions and market conditions, so ensure thorough research before diving into cryptocurrency investments. Neither the author nor this article assumes any responsibility for personal financial losses.
Source: Coingape


