The ongoing bullish recovery in XRP price took a positive turn on June 19th, when it broke through the $0.487 resistance level, providing buyers with a potential opportunity to further extend the upward momentum. At the moment, the altcoin’s value hovers around $0.49, striving to stay above the breached resistance point. However, the question remains: can this recovery overcome the substantial multi-month resistance of $0.55?
In analyzing the daily chart, the higher lows formed throughout the development of the triangle pattern signify a steady rise in bullish momentum. That said, it’s noteworthy that XRP price might experience strong selling pressure at the $0.55 level. The intraday trading volume for XRP is $1.04 billion, which reflects a 33% decline.
Over the past couple of days, XRP‘s price has fluctuated above the recently reclaimed $0.0167 resistance. This consolidation period featured long tail rejections in daily candles, indicating that buyers are actively defending the newly established support levels. If the bullish momentum persists, the XRP price could potentially surge by 9.6% and retest the $0.55 resistance barrier.
The importance of the $0.55 resistance level is evident, as it not only represents the multi-month resistance, but also serves as the neckline resistance of the triangle pattern. As a result, it stands as a high supply zone against buyers. As long as the overhead resistance and rising trendline remain unbroken, the XRP price is expected to maintain its sideways trend.
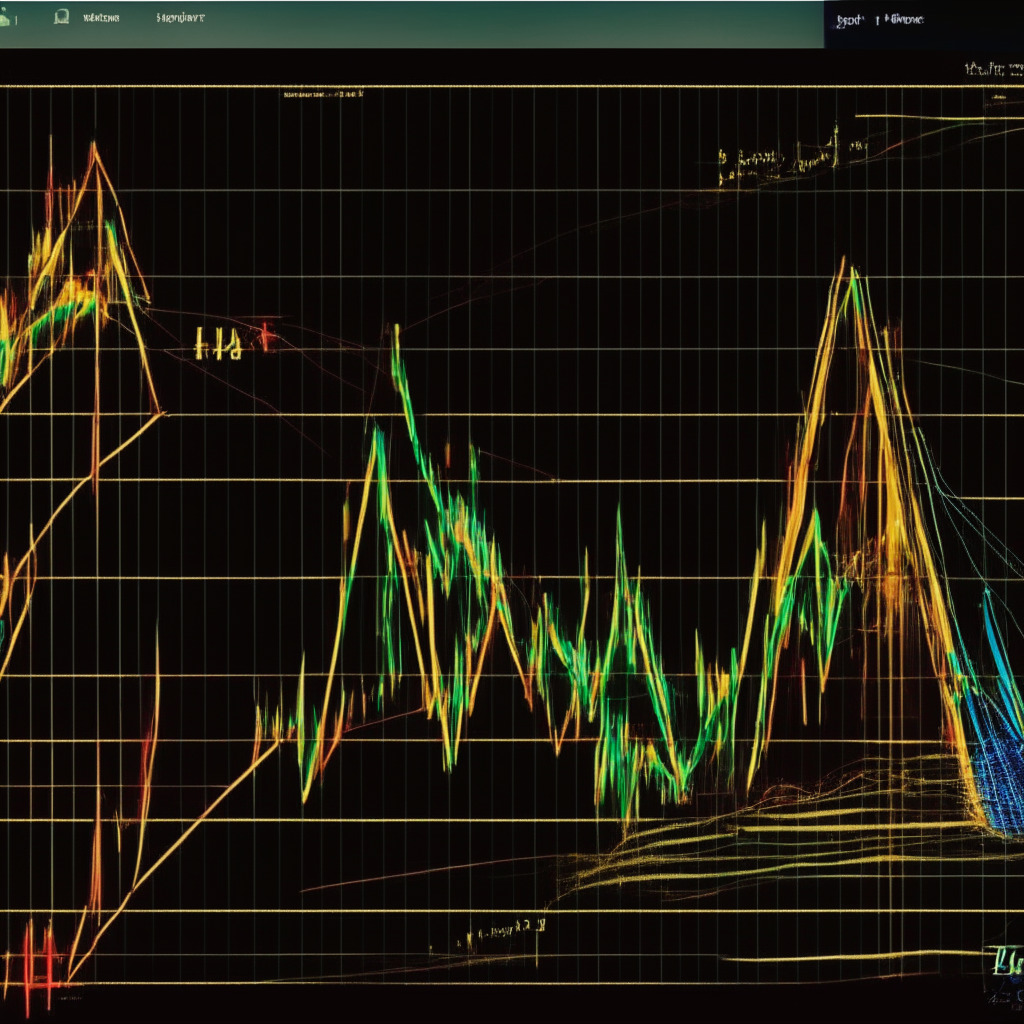
On the daily time frame chart, XRP price exhibits the formation of an ascending triangle pattern, which helps increase the underlying bullish momentum, ultimately preparing the asset for a breakout above the neckline resistance. Investors seeking an entry opportunity should consider entering at the rising trendline or could opt for a more convincing breakpoint at $0.55.
The daily Relative Strength Index (RSI) slope, which currently sits at 50%, showcases a neutral sentiment prevailing in the market. Meanwhile, the Bollinger Band indicator’s flattening bands suggest a volatile market with a high probability of the sideways trend continuing for an extended period.
While the information and opinions presented here reflect a personal point of view, it remains crucial for individuals to conduct proper market research before investing in cryptocurrencies. The author and the publication will not be held accountable for any personal financial loss.
Source: Coingape