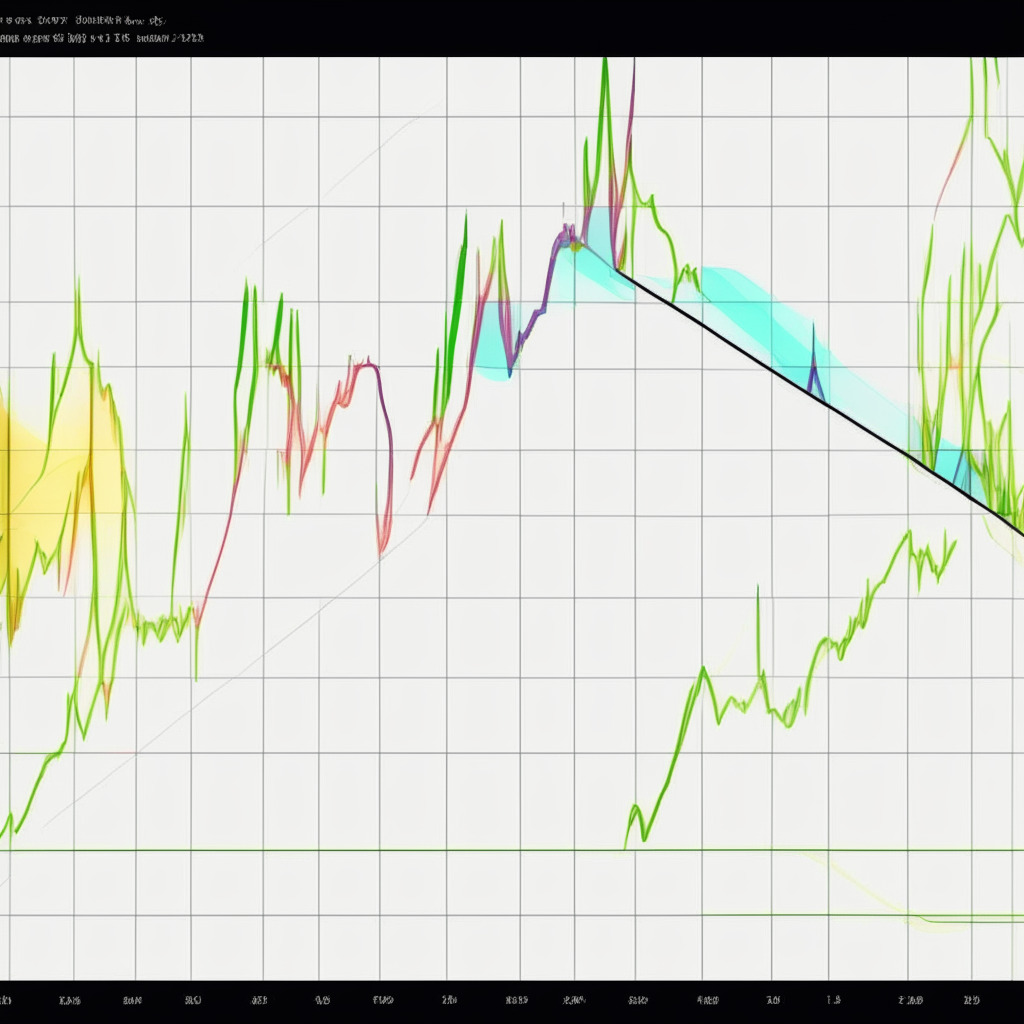
After witnessing an aggressive sell-off in early June, the MATIC price experienced a slight relief rally as market sentiment improved. On the 4-hour time chart, an ascending trendline has provided dynamic support to the buyers, maintaining a steady uptrend. With this in mind, could the current momentum propel polygon coin to surpass the $0.75 mark? This has been brought into question, especially since Cardano, Solana, and Polygon (MATIC) faced sell-off pressure fromRobinhood and Celsius.
The MATIC 4-hour price chart indicates decreasing volume associated with the current recovery, which suggests that this bullish rally may only be temporary. A breakdown below the rising trendline could restore selling momentum, leading to a continuation of the previous downtrend. In the meantime, the intraday trading volume for MATIC stands at $260.5 million, representing a 9% gain.
Over the past three weeks, the MATIC price displayed four bullish reversals from the rising support trendline, indicating active buying from investors and the potential for a sustained uptrend. As of press time, the Polygon coin is trading at $0.662 with an intraday gain of 2.7%. If this buying momentum is maintained, buyers could drive the prices up another 13% to reach the long-anticipated resistance trendline.
However, the overhead trendline might trigger a resurgence in selling pressure, allowing sellers to resume previous downtrends. A breakdown below the ascending support would offer further evidence for a potential downfall, possibly plunging the price to $0.59. The behavior of the MATIC price between these two aforementioned trendlines will be crucial in determining the near-future trend. Should bullish momentum persist, a breakout above the downsloping trendline would signal an early sign of a trend shift. This breached resistance could then act as a significant launchpad for pushing the coin price towards its first target of $0.818.
Looking at the technical indicators, a bullish crossover on the Moving Average Convergence/Divergence (MACD) between the MACD (blue) and signal (orange) line suggests a buy signal for short-term investors. Additionally, the rising MATIC price has reclaimed 4-hour Exponential Moving Averages (20, 50, 100, and 200), offering further evidence for a potential bullish recovery.
It’s important to note that the presented content reflects the personal opinion of the author, and market conditions are always subject to change. Conduct thorough market research before investing in cryptocurrencies, and be aware that neither the author nor the publication holds responsibility for personal financial losses.
Source: Coingape