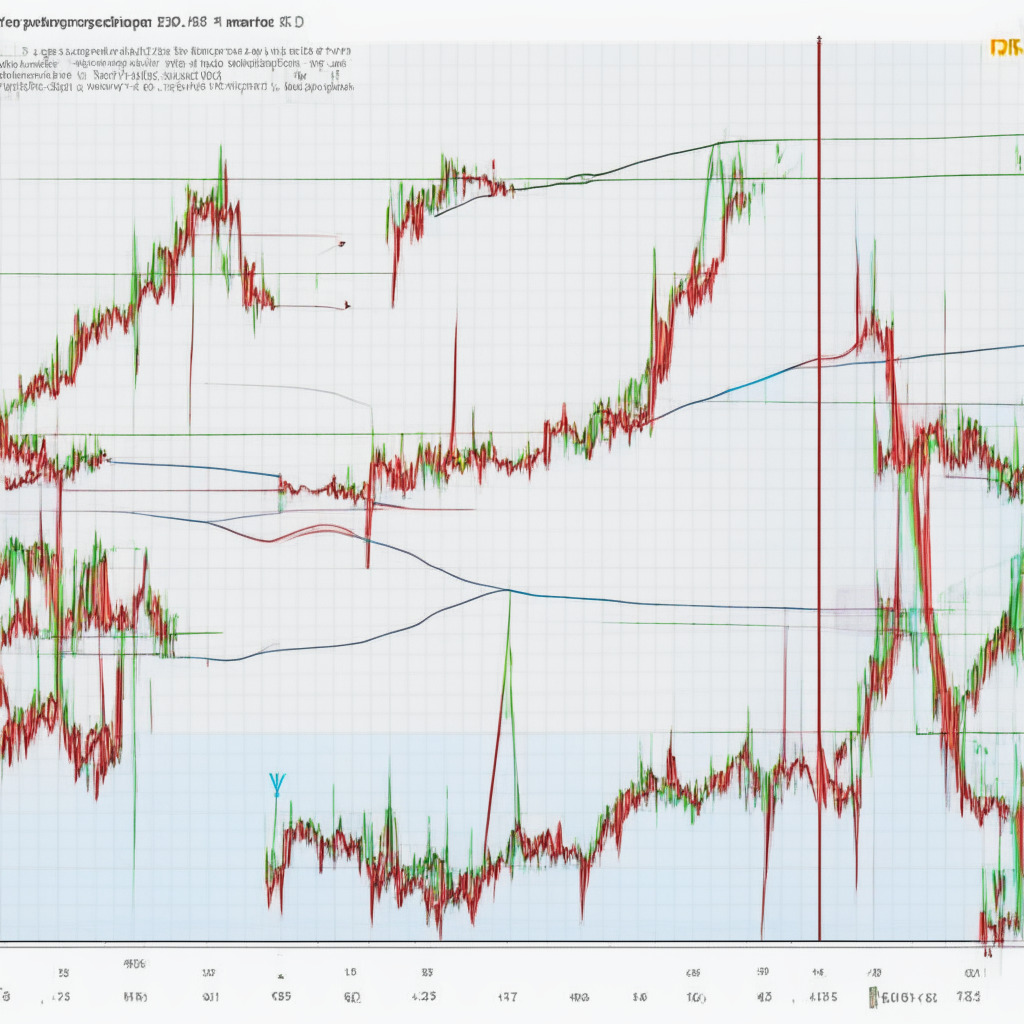
Over the past five weeks, the XRP coin price has experienced a significant correction, tumbling 20% from a high of $0.585 to the current price of $0.45. Interestingly, this retracement phase seems to be moving precisely between two downsloping trendlines, suggesting the formation of a flag pattern. This famous chart pattern, often found between established uptrends, offers an excellent long-entry opportunity for interested traders.
The decreasing volume activity indicates that the ongoing correction is likely temporary. A breakout above the overhead resistance trendline would signal the end of this retracement phase. However, the intraday trading volume in XRP has shown a 43% loss at $393.5 million.
Amid the current uncertainty in the crypto market, the falling XRP price has taken a temporary sideways turn, resonating between the $0.486 and $0.43 horizontal levels. This cluster of daily candles in a short space reflects the indecisiveness among market participants. If the coin price continues to move sideways, it may hit the pattern’s resistance trendline, potentially recuperating selling momentum. As long as the overhead trendline remains intact, the XRP price will likely prolong the correction phase to lower levels.
On the other hand, influenced by the flag pattern, the XRP price is more likely to breach the resistance trendline and flip it into potential support. This breakout would offer an entry opportunity for new buyers, potentially driving prices up 20% to rechallenge the $0.55 barrier.
The XRP price correction is still hovering above the 50% Fibonacci retracement level, indicating that the overall market trend remains bullish. Simultaneously, the Moving Average Convergence/Divergence (MACD) and signal line moving sideways suggest weakening bearish momentum.
In summary, the XRP price currently stands at $0.45, with a sideways trend and high volatility. The resistance levels are $0.485 and $0.56, whereas the support levels are $0.44 and $0.4. While there is indecisiveness in the market and ongoing uncertainty, the XRP price may continue moving sideways or even prolong its correction phase. However, influenced by the flag pattern, a potential breakout could drive the price up to challenge the $0.55 barrier once more. Traders should stay vigilant and conduct thorough market research before investing in cryptocurrencies, as the author and publication do not hold any responsibility for personal financial loss.
Source: Coingape