Amid the increasing selling pressure in the crypto market, the XRP price has plunged to the support trendline of a bullish continuation pattern called ‘Flag’. On April 8th, the daily chart showed a long-tail rejection called at a lower support trendline, indicating that buyers are actively accumulating at this support, potentially leading to a reversal. This pattern may further influence XRP’s coin future trend, but not without its share of skepticism.
The XRP price is falling for four consecutive days, reflecting aggressive selling pressure in the market. Moreover, a bearish crossover between the 20-and-50-day EMAs might accelerate selling pressure in the market. The intraday trading volume in XRP is $393.5 Million, indicating a 43% loss.
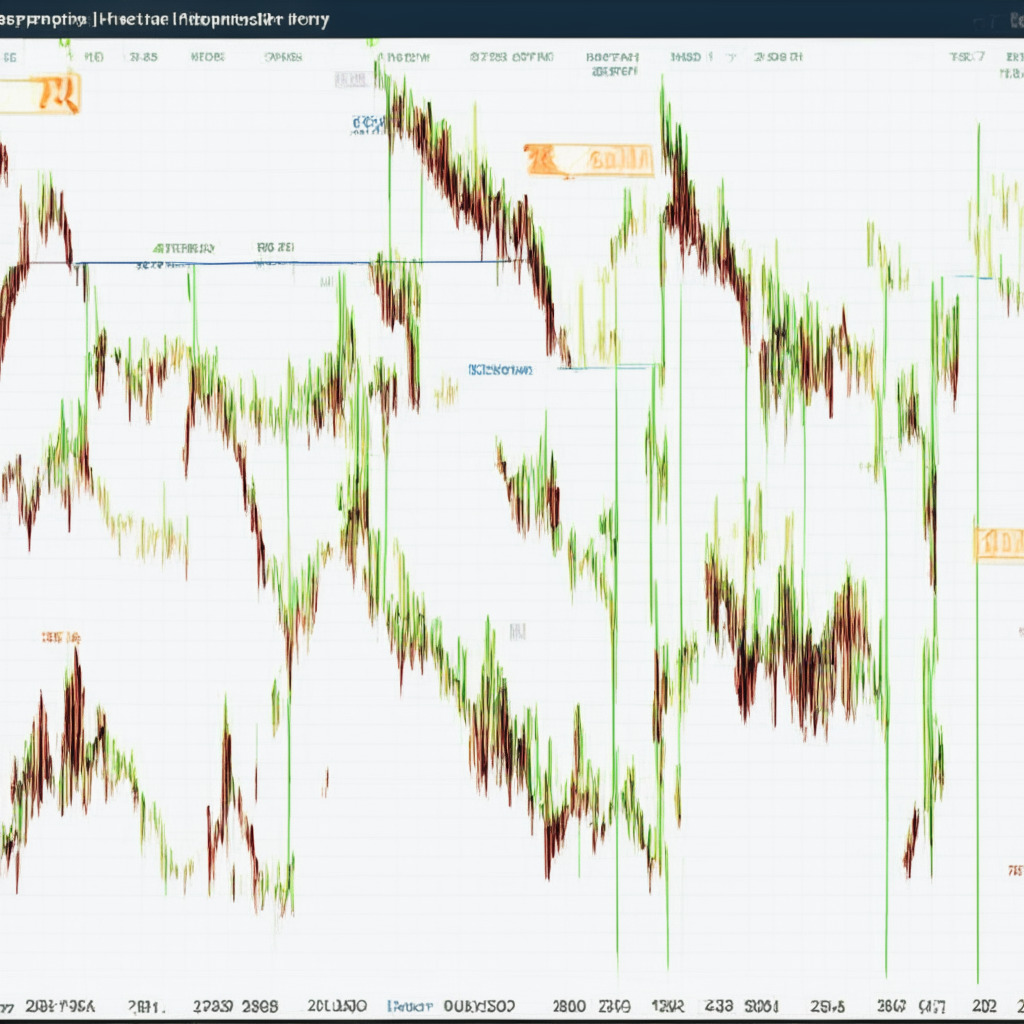
Under the influence of the ongoing bullish flag pattern, the coin price witnessed a temporary pullback which continues to resonate within two converging trendlines. At press time, the XRP price trades at $0.429 and hovers above the support trendline of this pattern. Furthermore, the trendline is currently aligned with an important monthly support of $0.43-$0.42, creating a strong accumulation zone for traders.
However, some caution is warranted should the bullish reversal signs from this level surge the XRP price back to overhead resistance, recording a 10% potential growth. Coin holders will get a better confirmation for a price recovery once the price breaches the overhead trendline. Still, the skepticism remains intact, as the market moves are unpredictable.
Taking a look at technical indicators, the Relative Strength Index (RSI) slope near the oversold region indicates that investors may want to accumulate XRP at a cheaper price. On the other hand, the recent downfall led coin buyers to lose the 200-day EMA support. If the coin price is unable to reclaim this EMA in the coming days, XRP may witness strong selling pressure.
As for XRP intraday price levels, the spot price is at $0.424 with a downward trend and low volatility. Resistance levels can be found at $0.48 and $0.547, while support levels are at $0.42 and $0.38.
In conclusion, the presented content reflects the author’s personal opinion, and investors should conduct their market research before investing in cryptocurrencies. As XRP price analysis demonstrates potential bullish reversals, it is essential to approach these predictions with caution and skepticism. The author or the publication does not hold any responsibility for an individual’s personal financial loss.
Source: Coingape