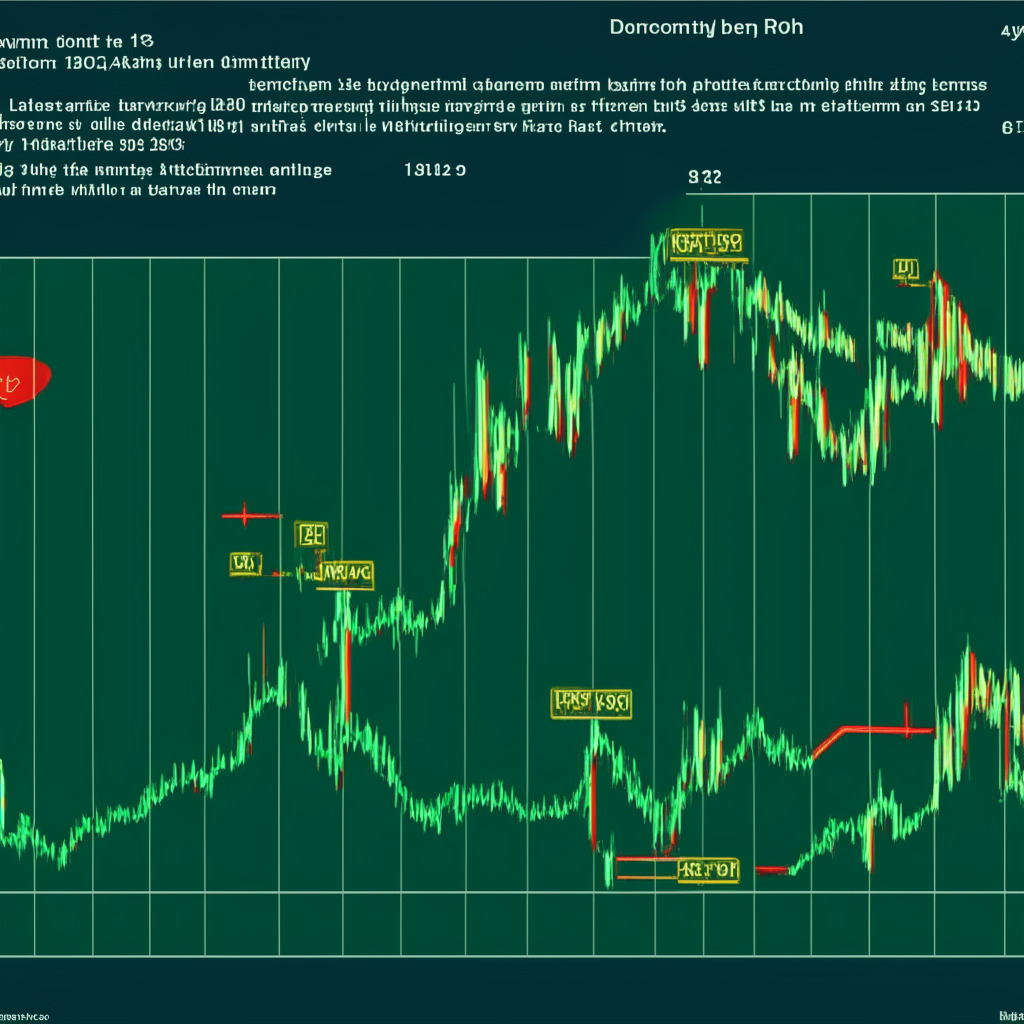
Over the past five weeks, the dogecoin (DOGE) price has experienced a sharp correction, plummeting from its peak of $0.105 to its current value of $0.07, a significant 31.6% loss. As the cryptocurrency market faces a downturn, Doge’s price seems to be closely following a falling wedge pattern, characterized by two downsloping trendlines converging at a single point. This pattern may present a long entry opportunity for traders.
The ongoing correction in Dogecoin’s price is expected to persist as long as the wedge pattern remains intact. However, a bullish breakout from the pattern’s resistance trendline could potentially trigger a 47.8% rally in DOGE’s price. The 24-hour trading volume in Dogecoin currently stands at $314.5 million, which indicates a 52% gain.
At the moment, DOGE’s price hovers above the lower trendline of the wedge pattern, as it seeks suitable support in the face of a broader market sell-off. Interestingly, the daily chart reveals numerous long lower price rejection candles at the trendline, demonstrating that buyers are accumulating at this level.
If the buying pressure continues, the coin’s price could potentially rise by 6.5% and reach the overhead resistance trendline. In order for Dogecoin price to embark on a sustained recovery, it must first break the pattern’s resistance trendline with a daily candle closing above it.
A breakout could signal the beginning of a bullish recovery, raising the coin’s price to potential targets of $0.081, $0.095, and even $1.0475. This would represent a maximum gain of 47.8% upon completion of the pattern.
As for the technical indicators, the Moving Average Convergence Divergence (MACD) shows a downwards slope, with the MACD line and signal line dipping into bearish territory. This suggests strong bearish momentum in the market. Meanwhile, the daily Exponential Moving Averages (EMAs) are concentrated around the $0.081 level, which could increase the resistance power at this price point.
Currently, Dogecoin’s intraday levels are as follows:
Spot rate: $0.0715
Trend: Bearish
Volatility: Medium
Resistance levels: $0.081 and $0.095
Support levels: $0.067 and $0.063
It is essential to remember that market conditions are subject to change, and one’s own market research should precede any investments in cryptocurrencies. The author and the publication disclaim any responsibility for personal financial losses that may occur.
Source: Coingape