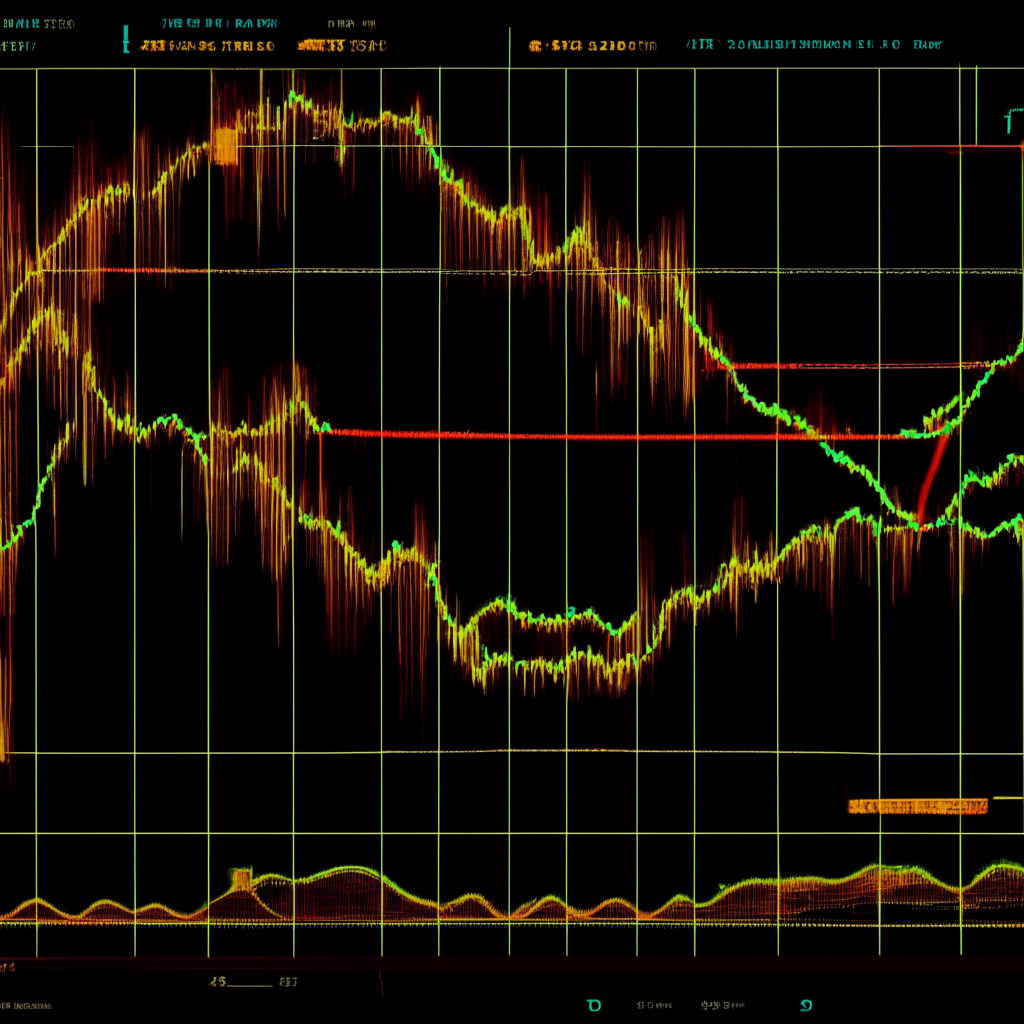
While several major cryptocurrencies have experienced uncertain and choppy behavior, the XRP price seems to be on a different path. In the last few days, the coin price has surged 15% from its last horizontal support at $0.417, reaching the resistance trendline of a falling channel pattern. The question on everyone’s mind now; is XRP ready to kickstart a new recovery rally with a breakout from this trendline, or are sellers still holding strong to prolong the downfall?
The price rally in XRP has been backed by an increasing trading volume, signifying sustained recovery. A breakout from the overhead resistance trendline could tempt buyers to enter the market and go long. The intraday trading volume for XRP currently stands at $780.4 million, a 14% gain.
At press time, XRP is trading at $0.46, showcasing an attempted breakout from the channel pattern’s resistance trendline. This pattern has maintained a steady downfall for almost two months, allowing sellers to replenish bearish momentum during price pullbacks.
A retest of the overhead trendline could be an opportunity to boost selling momentum and prolong the correction phase. If market sentiment remains unstable, traders should look out for rejection signs at the trendline to anticipate potential downfalls. These signs could lead to price reductions of up to 18%, revisiting the lower trendline.
On the other hand, a bullish breakout from the trendline with daily candle closure may bring back buying pressure to the XRP market. Should this happen, a recovery rally could draw closer, pushing prices by 20% higher to reach the crucial resistance level of $0.55.
Looking at the technical indicators, a bullish crossover between the DI+ and DI- slopes indicates a positive trend in the market. However, the ADX slope has yet to show an uptick, which suggests that buyers need to demonstrate strength to confirm this price reversal. In addition, the XRP price is above the daily exponential moving average (EMA), which could provide additional support for buyers challenging the overhead trendline.
Considering XRP’s intraday price levels, the spot price is at $0.461, with a bullish trend and low volatility. The resistance levels are $0.48 and $0.55, while support levels stand at $0.41 and $0.356.
It’s important to note that the content presented here includes the personal opinions of the author and involves market conditions. Conduct thorough market research before investing in cryptocurrencies. The author and publication assume no responsibility for any personal financial loss.
Source: Coingape