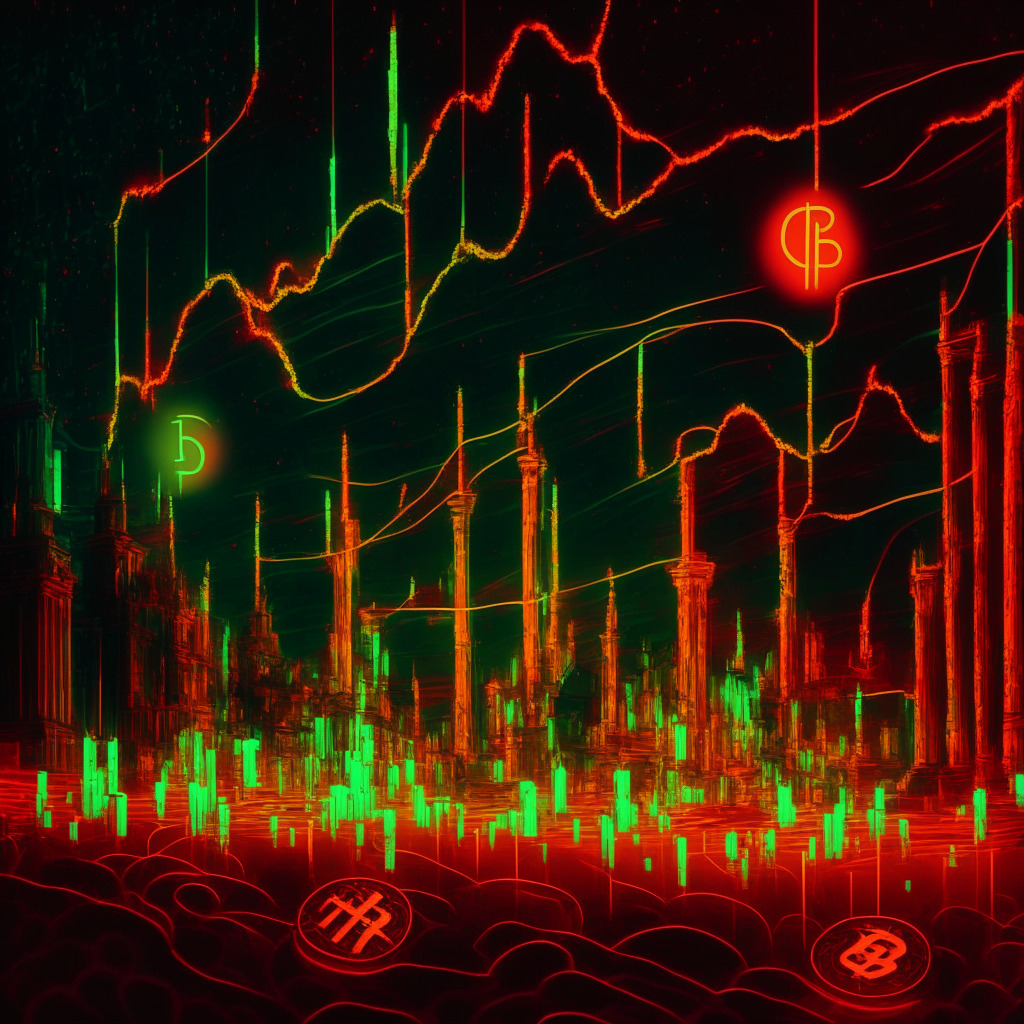
The Cardano price has been experiencing sideways movement for over two weeks, staying above the support trendline of the channel pattern, as per a recent Cointelegraph article. This suggests that buyers are actively accumulating at this level, which could potentially lead to a bullish reversal and the beginning of a new recovery cycle.
With the daily chart showing that red candles are struggling to gain follow-up on the downside, this buying pressure may indicate a higher probability of a bullish reversal. As long as the channel pattern remains intact, the ADA price is likely to stay bullish in the long term. A bullish breakout from $0.38 could trigger a resumption of a bullish recovery, while the intraday trading volume in ADA stands at $134.4 million, representing a 17% loss.
The Cardano price has been on a steady rally for the past four months, influenced by a rising channel pattern. Buyers have been utilizing the support trendline of this pattern to accumulate the altcoin at discounted prices and initiate a new recovery cycle.
Despite the recent market downturn, the ADA price has returned to the lower trendline, reflecting a greater likelihood of a bullish reversal. However, with the current market uncertainty, the coin price is hovering above the trendline sideways, trying to find suitable support.
If buying pressure persists, the Cardano price could surge and breach the immediate resistance of $0.38. This horizontal resistance breakdown would be a key signal for uptrend continuation, offering buyers a solid launchpad for rising higher. The potential recovery might propel the price towards the $0.419 barrier, followed by $0.46, marking a 25% growth.
On the other hand, a breakdown below the trendline could signify a significant weakness.
Looking at technical indicators, the daily Relative Strength Index (RSI) slope demonstrates an increase in buying momentum at this support level. Exponential Moving Averages (EMAs) – daily EMAs(20, 50, and 100) at the $0.38 level – augment the resistance power of this level. To hit $0.5, Cardano’s price would need a significant 37% growth. While this strong rally seems less likely to occur in the remaining days of May without major news, the reversal from the support trendline could gradually raise the price to the overhead trendline, possibly reaching $0.5 in the coming months.
In conclusion, investors should closely monitor market conditions and conduct thorough research before making decisions, as neither the author nor the publication holds responsibility for personal financial losses.
Source: Coingape