The Ethereum coin has started showing signs of trend reversal during November-December 2022 with the formation of a new higher low in price, according to the daily chart. The peak of April 2023 marked a higher high, suggesting a change in trend in compliance with the dow theory. This formation of higher peaks and troughs indicates an established bull trend, which may eventually push the ETH price higher.
The Ethereum Fear and Greed Index sits at 48%, projecting bullish sentiment among traders. A bullish breakout from the wedge pattern could offer lucrative long entry opportunities for traders. However, the intraday trading volume in Ether has dropped to $4.15 Billion, indicating a 25% loss.
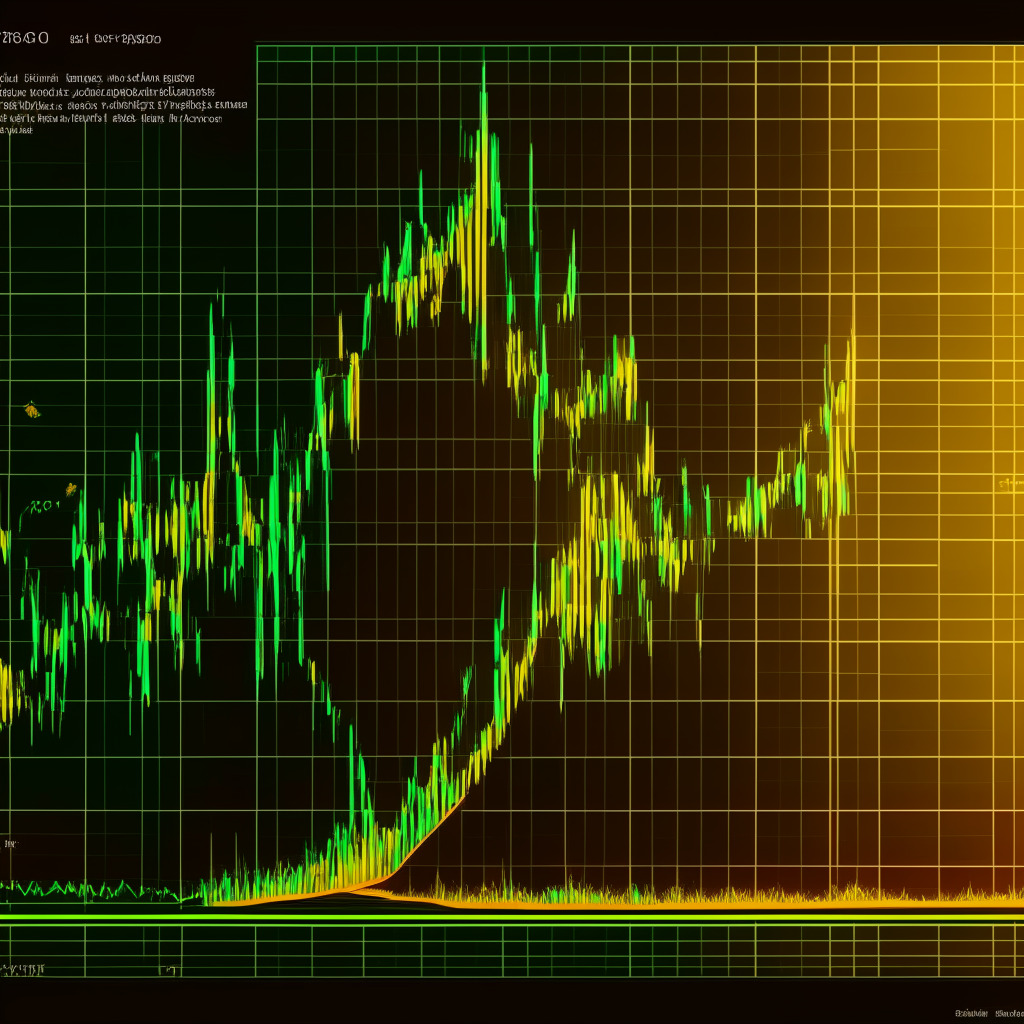
The coin price is obtaining robust support at the rising trendlines (yellow) formed by connecting the higher lows in the Ethereum price, thus allowing potential buyers to accumulate at the dips. Until these two trendlines remain unbroken, the ETH price is expected to maintain its bullish outlook in the long run.
Over the past month, the Ethereum price has experienced a correction phase influenced by a wedge pattern. From the peak of $2138 in April 2023, the prices have plummeted 15% to reach the current level of $1813. In light of the more extended bullish trend, this correction seems temporary and might present traders with another pullback opportunity for reaccumulation.
Currently, the Ethereum price trades at $1813 with an intraday change of 0.01%. Interested buyers should watch for a bullish breakout from the overhead trendline of the wedge pattern, as this could potentially revamp the buying momentum and empower buyers to surpass the $2138 swing high.
From a technical perspective, the ETH price is moving above the 100-and-200-day Exponential Moving Averages (EMAs), indicating a bullish market sentiment. Furthermore, the ongoing correction phase remains above the 50% retracement level, as shown by the Fibonacci Retracement Tool, providing additional confirmation that buyers maintain the upper hand.
Ethereum Coin Price Intraday Levels include a spot rate of $1812, a bearish trend, high volatility, resistance levels at $1830 and $1920, and support levels at $1700 and $1600.
Keep in mind that this content represents the author’s personal opinion and is subject to market conditions. Don’t forget to conduct thorough market research before investing in cryptocurrencies. Neither the author nor the publication holds any responsibility for possible personal financial loss.
Source: Coingape