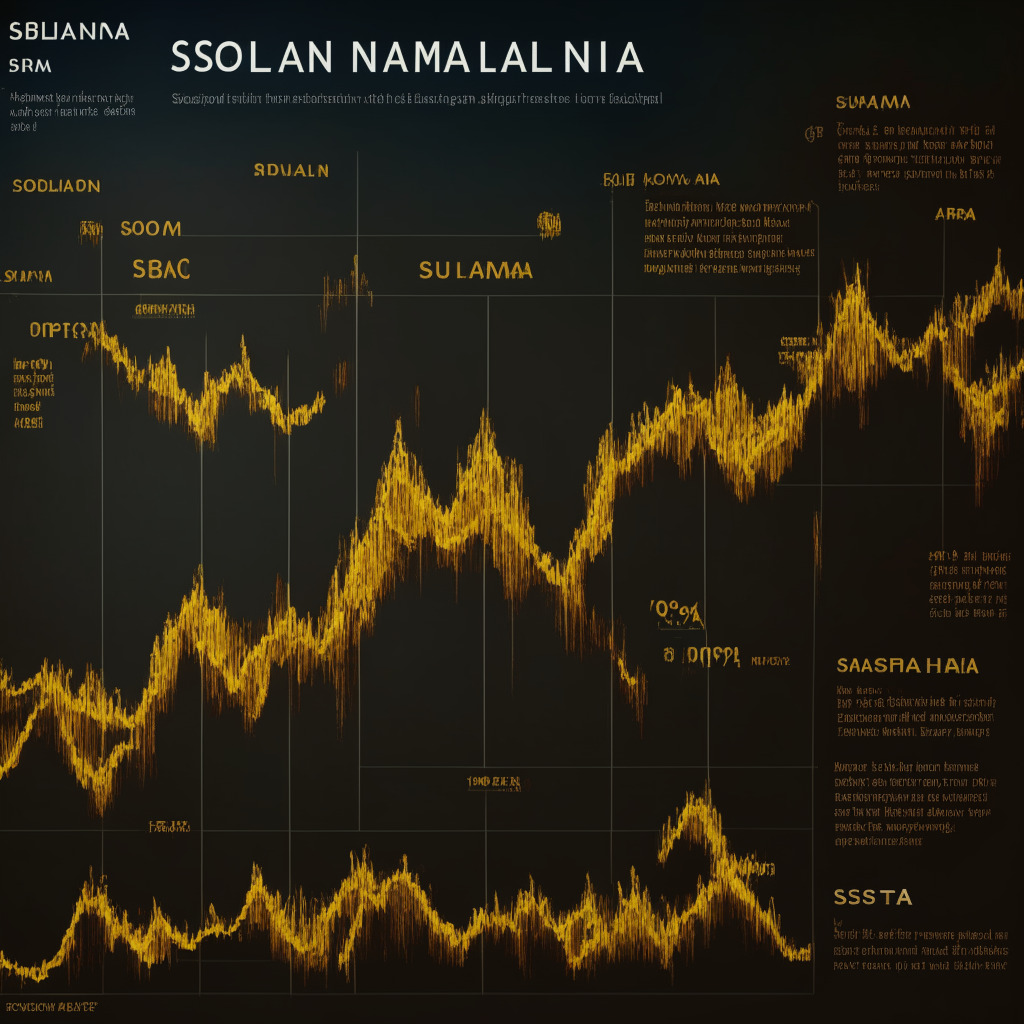
For more than a month, the Solana price has experienced a correction phase due to the influence of a falling wedge pattern. From the local peak of $26, the coin’s value dropped nearly 22%, reaching its present level at $20.23. Despite the prevailing market uncertainty, the coin’s value remains true to this pattern and may provide substantial growth potential once it is completed.
Inside the wedge pattern, Solana’s narrow price range suggests that it is currently in a no-trading zone. A bearish crossover between the 50-and-100-day EMA might result in increased selling pressure in the market. Meanwhile, Solana’s 24-hour trading volume stands at $146.5 million, reflecting a 37% decrease.
Amid the ongoing uncertainty in the crypto market, Solana’s price action continues to move downward within the wedge pattern. Fundamentally, the wedge pattern is a bullish continuation pattern, implying that the current decline in Solana’s value is temporary.
As a result of this pattern, prices are more likely to surpass the resistance trendline and rekindle a bullish recovery. A daily candle close above the trendline could provide a long-entry opportunity and give buyers a strong footing for upward momentum.
According to some speculations, the post-breakout rally might push Solana’s value 30% higher, retesting the peak of $26.1. If this multi-month resistance level is breached, the price could potentially reach $30. However, as long as the wedge pattern remains intact, the ongoing correction phase may further impact the altcoin’s worth.
On the technical side, the Moving Average Convergence Divergence (MACD) indicator reveals a sustained selling momentum in Solana’s price, with the downsloping MACD (blue) and signal (orange). In contrast, the daily Exponential Moving Averages (EMAs) of 20, 50, and 100 resting just above the Solana price suggest a potential recovery, albeit with various obstacles ahead.
As for Solana’s intraday coin price levels, the current spot price stands at $20.23, with a bearish trend and high volatility. Resistance levels are found at $21.3 and $24, whereas support levels are at $17.7 and $16.
It is essential to keep in mind that the presented content may include the personal opinion of the author and is subject to market conditions. Always conduct thorough market research before investing in cryptocurrencies, as neither the author nor the publication holds any responsibility for personal financial losses.
Source: Coingape