Over the past two weeks, the Ethereum price has shown a lack of conviction from buyers and sellers, consolidating within a narrow range. However, the bigger picture suggests the formation of a famous bear continuation pattern—a rising wedge. Under this development, the ETH price is currently caught in a bear cycle within the pattern, pointing to a potentially longer correction phase.
The Ethereum Fear and Greed Index at 47% underlines a neutral sentiment among market traders. A breakdown below the $1,700 support could signal a further slide. With the intraday trading volume in Ether at $6.4 billion and a 0.14% loss, the current situation seems uncertain.
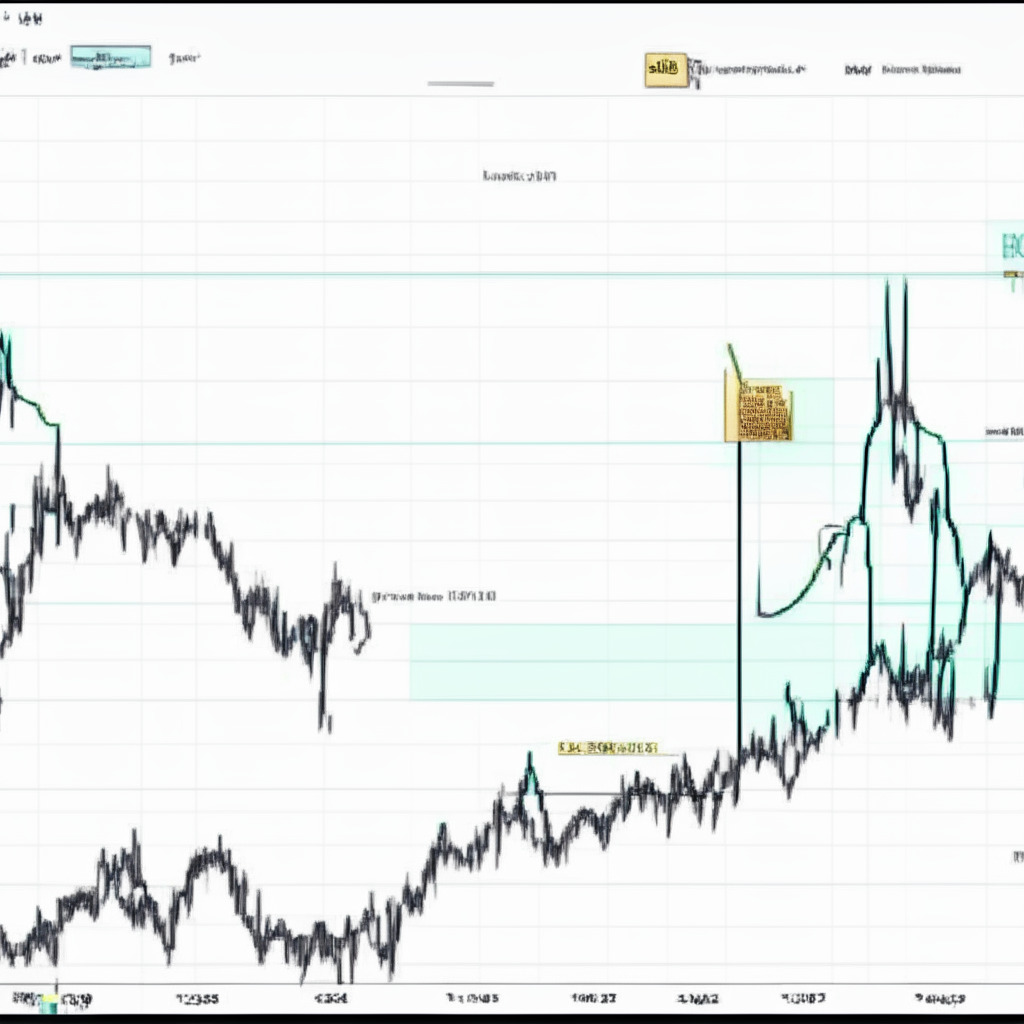
In mid-April, Ethereum price fell from the resistance trendline of the wedge pattern, initiating a new bear cycle. From its peak of $2,138, this decline brought prices down by 15.48% to the current $1,798. However, the ETH price encountered minor resistance at the $1,740-$1,714 support level and turned sideways. Influenced by the chart pattern, the overall setup favors a potential downfall, suggesting the current consolidation could be temporary.
If bearish momentum strengthens, a breakdown below the $1,714 support could drive prices down by 18.5% to hit the support trendline at $1,400. However, coin holders can maintain an overall bullish outlook as long as the pattern’s lower trendline remains intact. Should the ongoing consolidation phase result in a breakdown of the $1,714 support level, Ethereum price could experience a longer correction towards the $1,400 mark, with a significant blockade at the $1,500 psychological support.
Notably, a downtick in the upper band of the Bollinger Band indicator suggests increasing selling momentum and extra opportunities for short-selling. The Relative Strength Index (RSI) follows suit, reflecting additional confirmation of a possible downswing as it plunges below the 60% barrier.
It’s crucial to keep in mind that the presented content reflects the author’s personal opinions and forecasts based on market conditions. Conduct thorough market research before investing in cryptocurrencies to avoid financial loss due to market fluctuations.
Source: Coingape