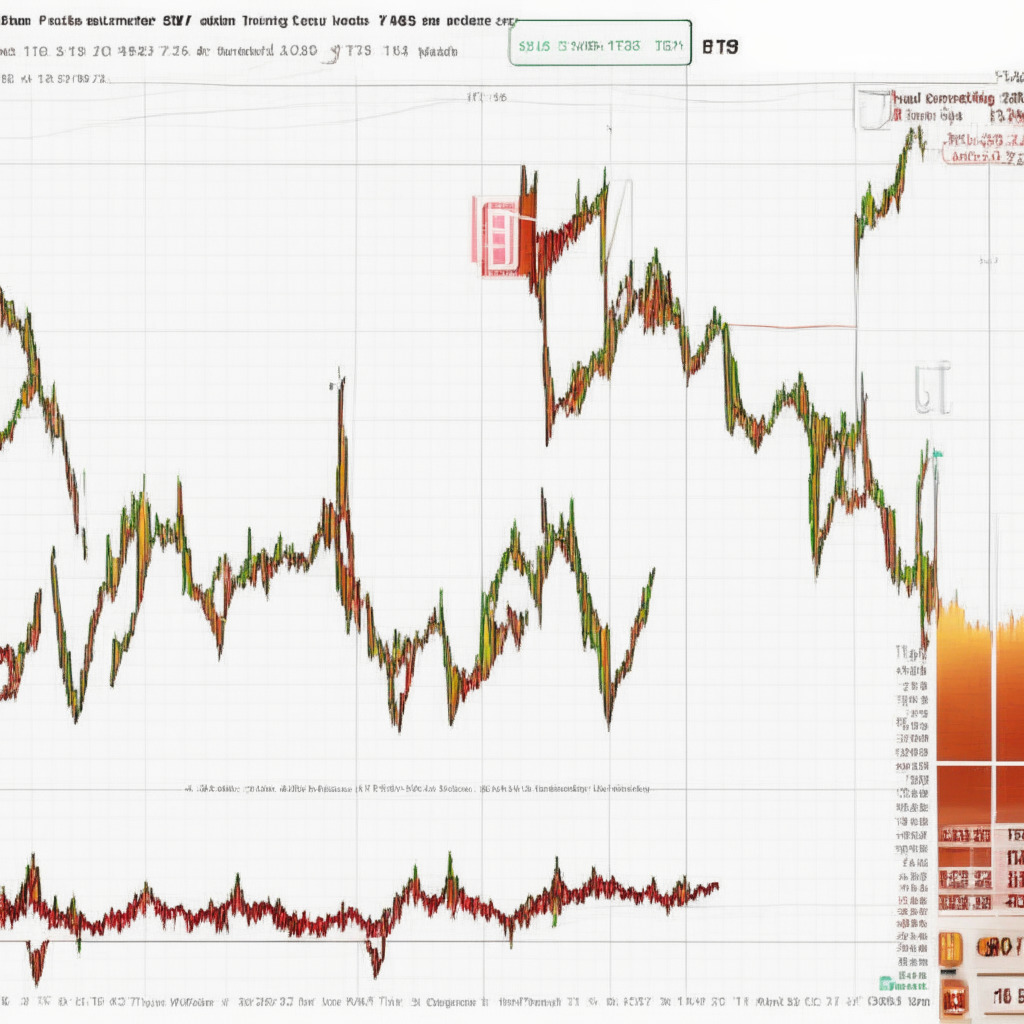
A recent 1.67% intraday gain in Ethereum price has sparked the formation of a bullish candle pattern known as the morning star in the daily time frame chart. This reversal candle, observed at the range support of $1789, indicates that buyers remain committed to this level and may even maintain the current sideways trend.
However, the threat of a down-sloping trendline impacting the Ethereum price still looms. If it does hit, it will bring an influx of selling orders to the market and potentially reinforce the continuation of the prior retracement phase.
As of now, Ethereum’s price appears to be undergoing a bullish reversal from the $1789 support, placing it on an upward trajectory towards the $1870 barrier. This expected rise could result in a short gain of 2%, potentially signaling another breakout attempt after two weeks of consolidation. Yet, the $1870 level is accompanied by the dynamic resistance of the falling wedge pattern, which has been governing the current correction phase in the crypto market, specifically affecting the second-largest cryptocurrency.
This situation may result in increased selling pressure, causing the Ethereum price to decrease again. A daily candle closing below the $1789 support could drive the price back to $1715 support levels.
It is essential to note that if the price does reverse from the $1870 level, it would further signify the continuation of the ongoing downtrend in Ethereum price. In this scenario, the altcoin’s setback could push it to create a new lower low at the $1700 mark. Concurrently, the 200-day EMA slope and this support level would propose a challenging breaking point.
Several indicators provide valuable insight into Ethereum’s current trends:
1. Supertrend: The red film projected in the daily chart suggests that the overall market trend remains bearish.
2. Vortex Indicator: The first bullish crossover between the VI+ (blue) and VI- (orange) in two weeks indicates that the Ethereum price is more likely to rise and hit the $1870 barrier.
Although the presented content is subject to market conditions and includes the personal opinion of the author, it is critical for investors to conduct their market research before investing in cryptocurrencies, as the author or publication does not hold responsibility for personal financial loss.
Source: Coingape


