Amid the ongoing recovery in the crypto market, the Bitcoin price has breached a significant resistance zone of $27,500-$27,300. This breakout was anticipated to revitalize buying momentum and resume the previous recovery. However, buyers failed to surpass the immediate resistance trendline of the falling channel pattern. This reversal may signal that the correction phase isn’t quite over for Bitcoin holders.
The falling channel pattern continues to keep Bitcoin price under threat for prolonged correction, while the breakout above the overhead trending line has the potential to kickstart a fresh recovery rally. The intraday trading volume in Bitcoin is $5.68 billion, marking a 12.5% loss.
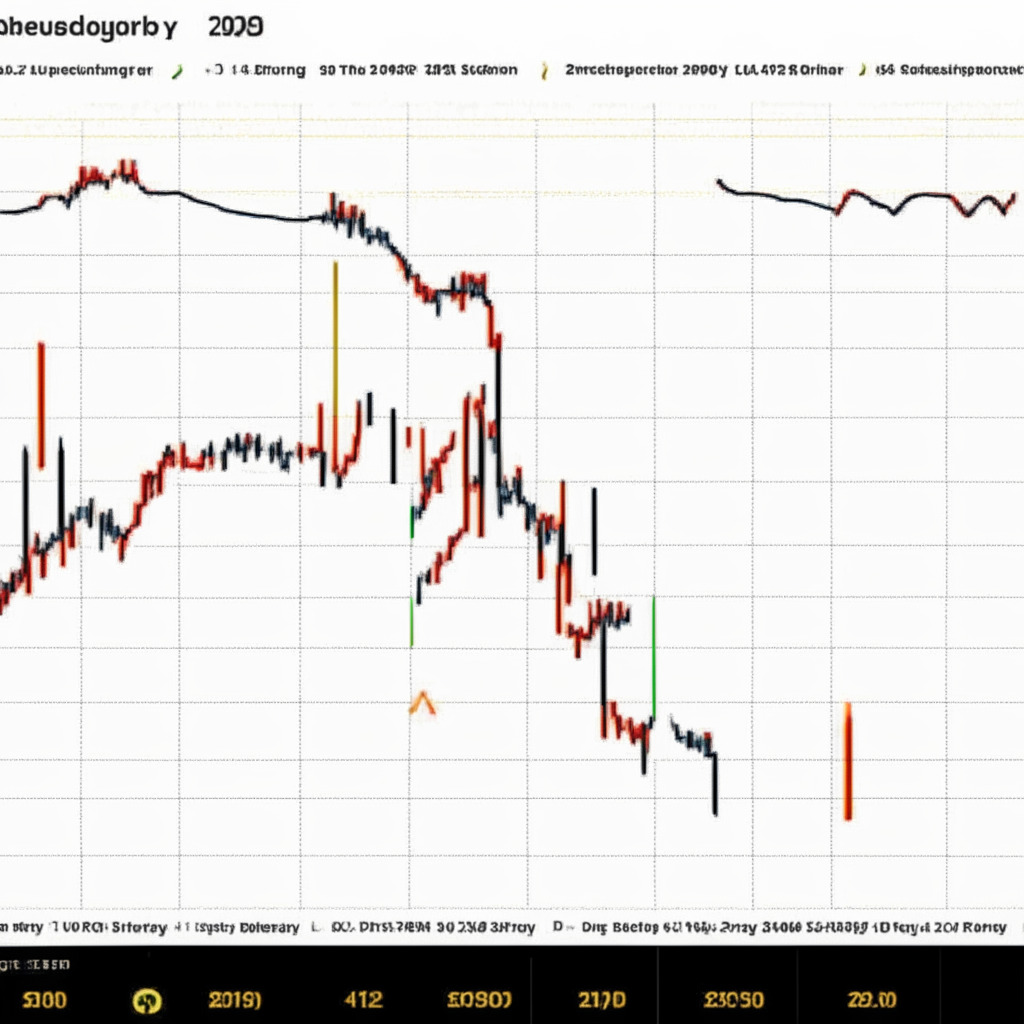
By press time, the Bitcoin price is trading at $28,043, and it wobbles between the breached $27,500 level and the overhead trendline. Both aforementioned levels strongly influence the Bitcoin price, and their breakout could determine the upcoming trend.
In theory, when the falling channel pattern is completed, it usually bolsters significant growth. The current recovery phase in the market suggests that the Bitcoin price is more likely to break above the resistance trendline. A daily candle closing above this wedge trendline will boast its underlying bullish momentum and offer a long positional trade for interested buyers. The resulting rally could push the Bitcoin price to its last two highs of $31,170, marking a potential growth of 11.5%.
On the other hand, a breakdown below the $27,300 mark could resume the ongoing correction to the $25,000 mark. Further recovery in the Bitcoin price would depend on a breakout from the long-coming resistance trendline of the channel pattern. This potential breakout will intensify the buying pressure and may push the coin’s price to new highs.
The Supertrend indicator, which defines the market trend by projecting a red film, suggests that the current market trend remains bearish. Meanwhile, the daily Relative Strength Indicator (RSI) slope has yet to breach the 60% mark, which indicates that buyers need higher momentum to retake control of the trend.
While this market analysis offers potential scenarios for Bitcoin’s price movements, it is crucial to conduct thorough market research before investing in cryptocurrencies, as personal opinions and market conditions can vary. The responsibility for personal financial loss ultimately falls on the investor themselves.
Source: Coingape