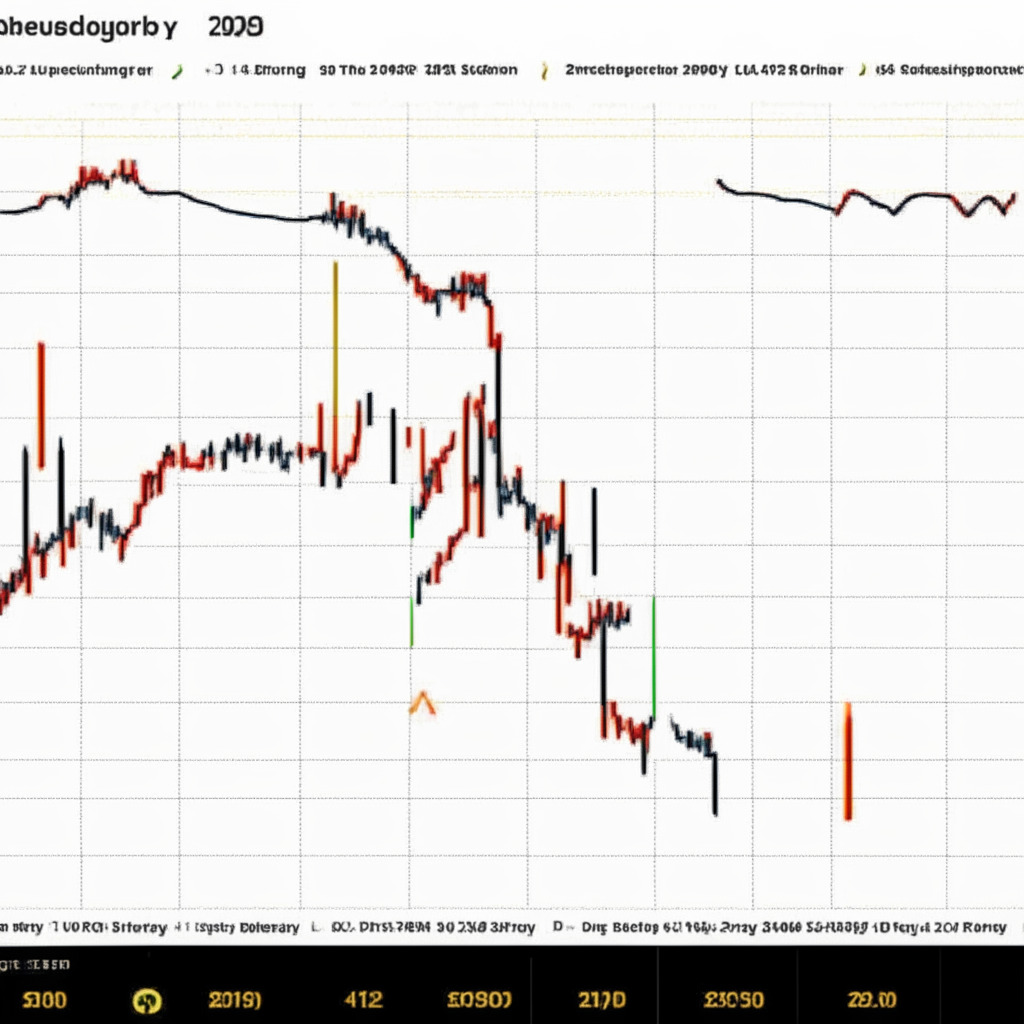
With the rising selling pressure in the cryptocurrency market, the Cardano coin price experienced a bearish breakdown from the neckline support of the head and shoulder pattern. This well-known bullish reversal pattern is typically found at market tops, increasing the underlying selling momentum in a coin. From the breakdown point near $0.38, the altcoin plunged by 3.5% and is currently trading at $0.367. Traders may be able to take advantage of a short-selling opportunity from this pattern.
The ADA price dropped below the daily Exponential Moving Averages (20, 50, 100, and 200), suggesting that a possible rally could face multiple resistance levels. The intraday trading volume in ADA is $272.5 million, indicating an 8% gain.
At present, the Cardano price is up by 0.38% and displays a green Doji candle in the daily timeframe. This uncertain candle formed after a decline, hinting that the ADA price may experience a minor bullish pullback to retest the breached neckline of the H&S pattern. This retest will validate the price’s sustainability below the breached level of $0.38, offering a short-selling opportunity for traders.
Under ideal conditions, an H&S pattern breakdown provides a potential fall of the same distance between the head peak and neckline. As a result, the ADA price could tumble by 18% and hit the support level of $0.3 from March. Furthermore, a new resistance trendline is currently driving the correction phase in the daily chart. A breakout above this trendline would invalidate the bearish thesis and help buyers reclaim higher grounds.
From a technical indicator perspective, the daily Relative Strength Index (RSI) slope is diving deeper into bearish territory, indicating high bearish momentum in the market. Additionally, a potential bearish crossover between the 20-and-50-day EMAs could provide a sell signal for market participants.
In terms of intraday levels for the Cardano coin price, the spot price is at $0.365, with a downward trend and medium volatility. Resistance levels are at $0.4 and $0.42, while support levels are at $0.346 and $0.32.
It is important to note that the presented content may include the personal opinions of the author and is subject to market conditions. Conduct thorough market research before investing in cryptocurrencies, as the author or the publication does not hold any responsibility for personal financial losses.
Source: Coingape