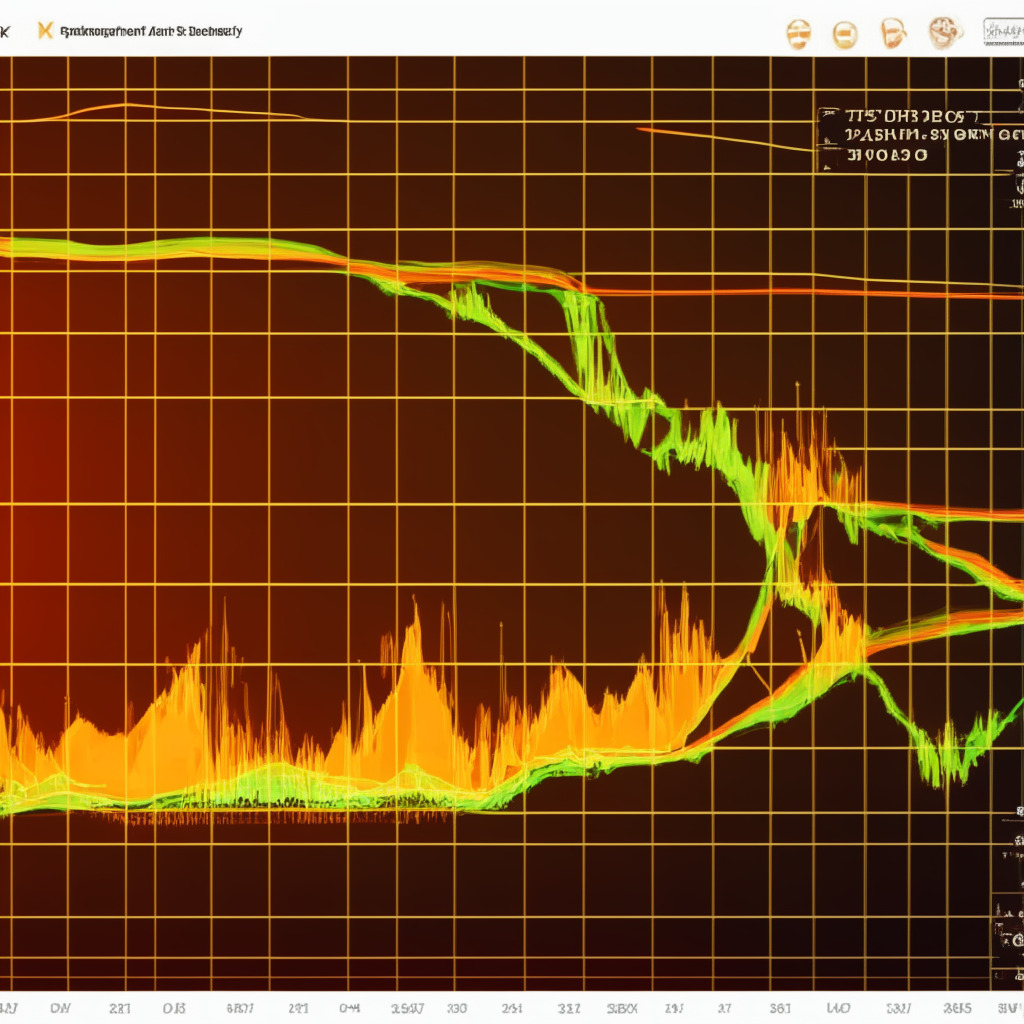
The last correction phase in SUI price has found significant support at the $1.02 level, with the coin price rebounding twice in just a week. This indicates that buyers are actively accumulating at this level. Within a mere three days, the coin’s price surged 22% from the aforementioned resistance, reaching the $1.26-$1.245 neckline resistance of a popular bullish reversal pattern called the double bottom. This pattern might pique the interest of traders looking to enter long positions.
A bullish breakout from $1.26 could trigger a double-bottom pattern, and the reclaimed EMAs 20 and 50 might encourage buying orders in the market. The intraday trading volume in the SUI coin is $429.5 million, signifying a 138% gain. In the 4-hour time frame chart, the SUI price shows the formation of a double bottom pattern, which implies that the underlying buying pressure of the coin is increasing, offering significant growth potential.
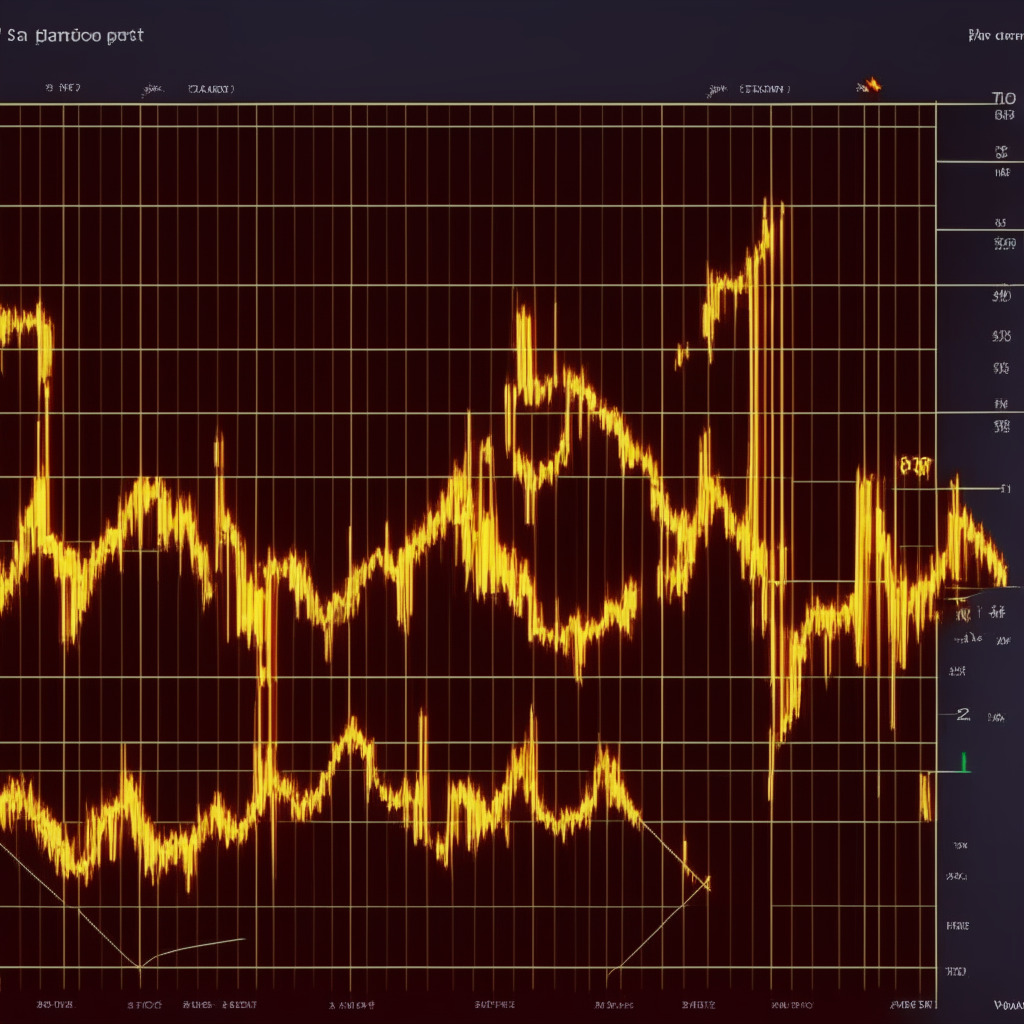
However, the coin price is currently trading at the $1.22 mark and continues to fluctuate below the $1.26-$1.245 neckline resistance of the pattern. The rejection candle observed at this barrier suggests that the altcoin might experience a minor pullback before challenging the neckline.
A potential breakout from $1.26 with candle closing will provide interested buyers an entry opportunity and a flipped support to continue escalating to higher levels. This post-breakout rally could push prices 16.5% higher, reaching the $1.47 mark. On the other hand, a breakdown below the immediate support of $1.2 will invalidate the bullish thesis.
The technical indicators point towards a bullish recovery. The 4-hour chart RSI slope shows evident growth, while the upper band of the Bollinger Band indicator is already being challenged, indicating that the SUI price is witnessing a robust bullish momentum.
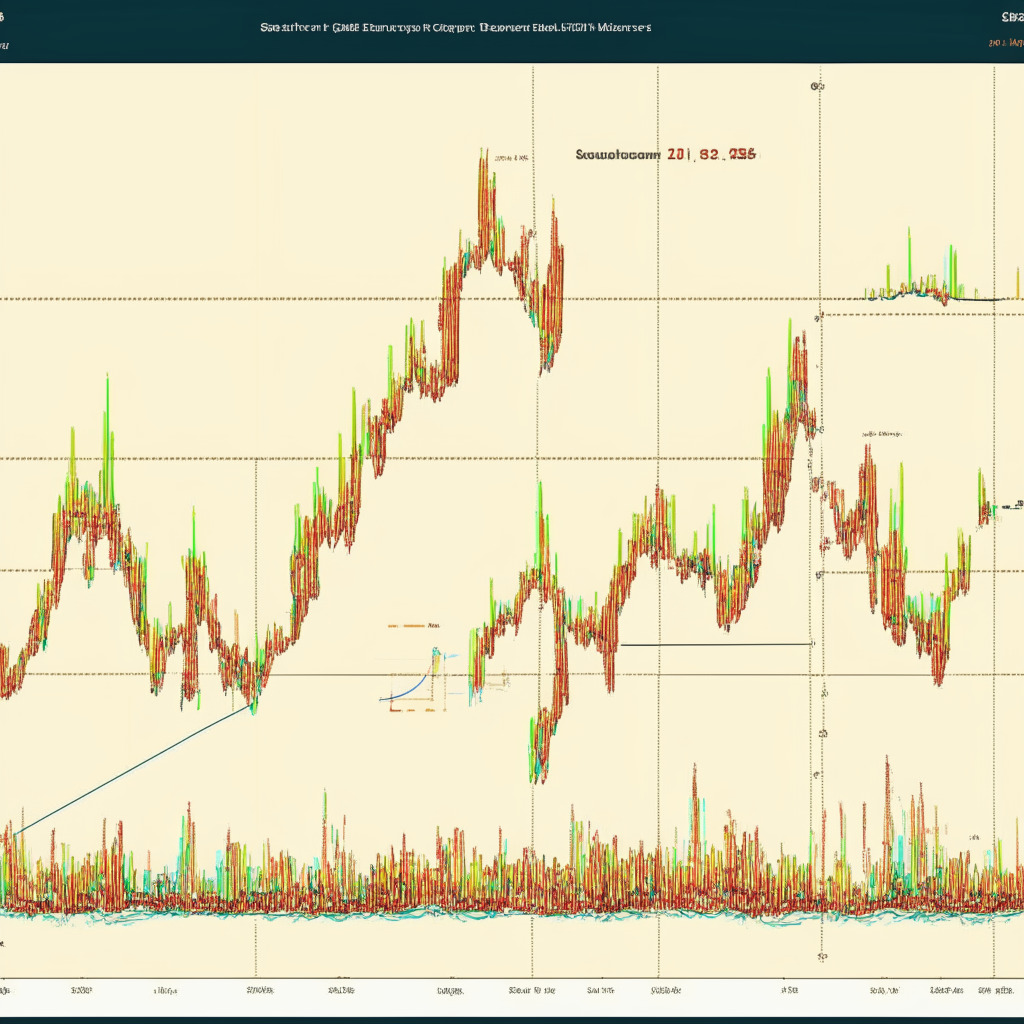
SUI coin’s price intraday levels include a spot price of $1.23, a bullish trend, medium volatility, resistance levels at $1.27 and $1.377, and support levels at $1.14 and $1.08. Although the presented content includes the author’s personal opinion, market conditions should always be considered. It is crucial to conduct thorough market research before investing in cryptocurrencies, as neither the author nor the publication holds any responsibility for personal financial losses.
Source: Coingape