In the midst of growing uncertainty within the cryptocurrency market, a short support trendline has been protecting the Ethereum price from a major downfall in recent times. The coin price managed to bounce thrice from the rising trendline in the last two weeks, suggesting that buyers are eager to claim some of the lost ground by purchasing during minor dips. However, today’s abrupt downturn in the crypto market led to an increased outflow in Ethereum’s price and eventually breached the support trendline for a more significant drop.
A potential bearish crossover between the 20-and-50-day EMA could increase selling momentum in the market, while a breakout above the wedge pattern resistance might signal an early sign of trend reversal. Ethereum’s intraday trading volume currently stands at $5.5 billion, which translates to a 7.4% loss.
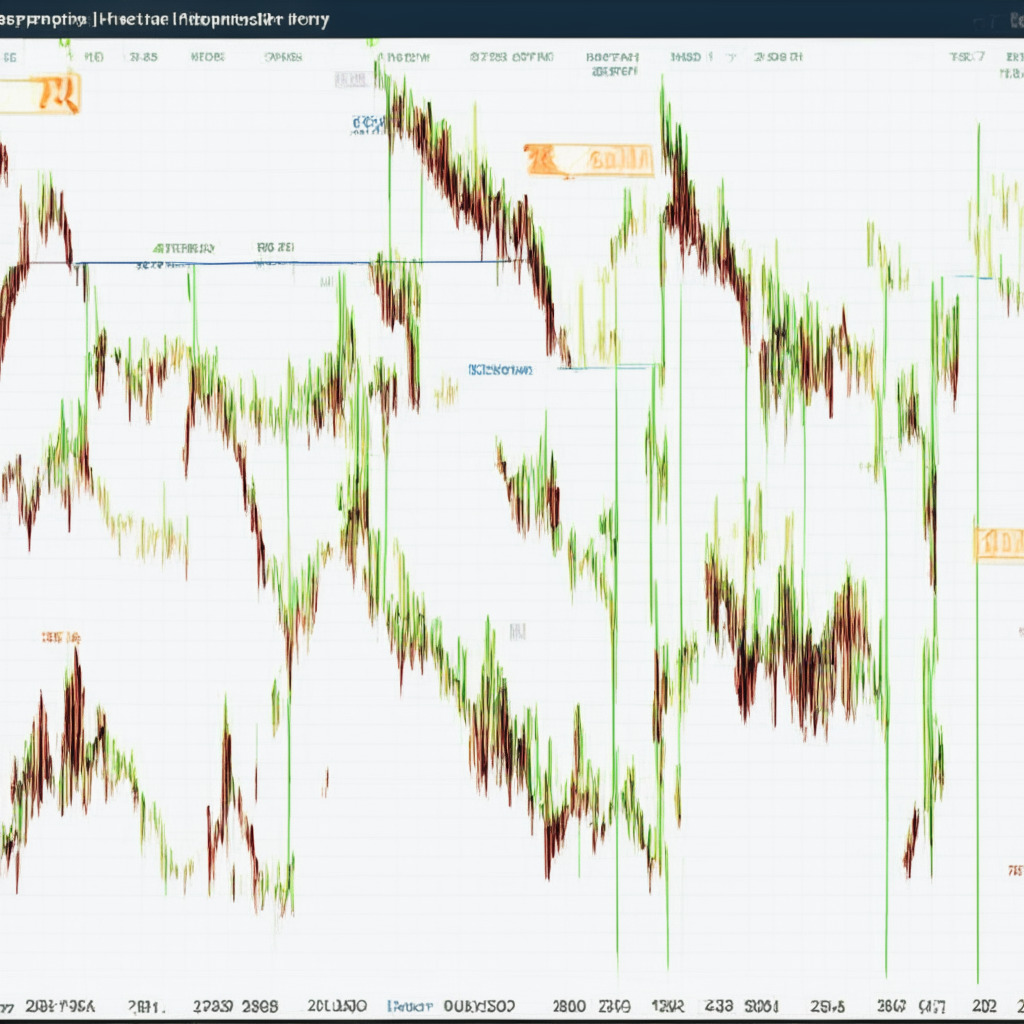
With an intraday loss of 3.35%, the Ethereum price showcases a decisive breakdown from the support trendline on the 4-hour timeframe chart. Losing this support may ramp up the selling pressure on Ethereum’s price, resulting in the increased likelihood of further decline. The post-breakdown fall could cause the coin price to plummet by 4.7%, hitting the combined support of $1700 and the lower trendline of the wedge pattern. A retest of the support trendline might initiate a new recovery cycle in Ethereum’s price, but to ensure a sustained bull run, it would require a daily candle closing above the trendline.
A bullish breakout from the resistance trendline could provide a key signal for the resumption of an uptrend and give buyers an entry opportunity. However, the question remains: Will Ethereum’s price break below $1700? A successful breakdown below the ascending trendline sets Ethereum’s price downfall to $1700. Still, this level is accompanied by a support trendline of the wedge pattern and the 200-day EMA, creating a strong demand zone for buyers. As a result, there is a higher probability of a potential reversal from this psychological level.
On the other hand, the Super trend indicator projects a red film, indicating that sellers have regained control of the trend. Additionally, an uptick in the Average Directional Index (ADX) slope reflects the strength in selling pressure, suggesting a higher possibility of a potential fall.
It’s crucial to note that this content may include the author’s personal opinion and is subject to market conditions. Before investing in cryptocurrencies, conduct thorough market research. Neither the author nor the publication holds any responsibility for personal financial loss.
Source: Coingape