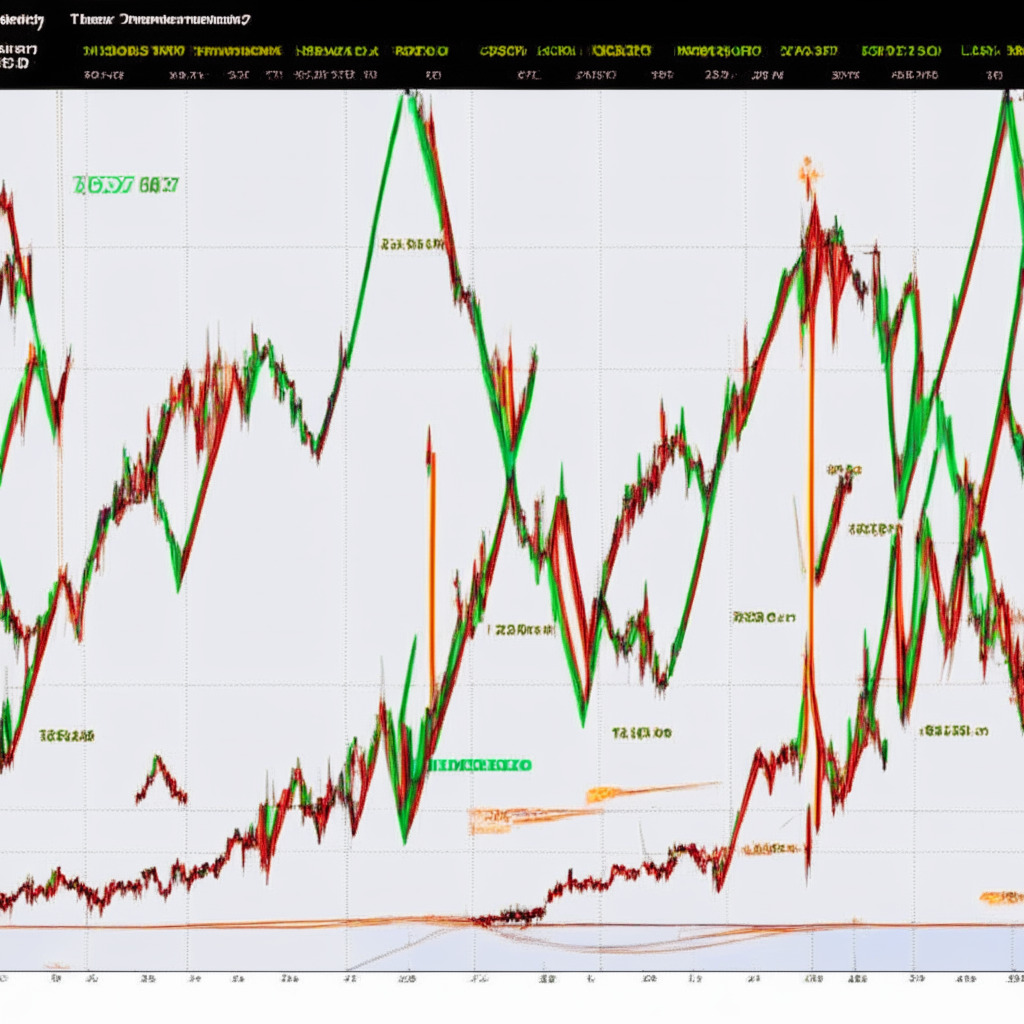
Over the past few days, the crypto market witnessed a significant uptick in buying activity, resulting in notable price gains for many major cryptocurrencies. One such example is the recent price surge for Ethereum, which saw its value rebound from local support at $1790 and rise 3% to test the overhead resistance at $1870. The key question is whether buyers are prepared to break this crucial barrier, or if we’ll see an extended correction in the near future.
Earlier on, Ethereum’s daily chart revealed a 1.62% intraday gain, hinting at another attempt to breach the $1870 resistance. However, this level is further reinforced by an angular resistance trendline stemming from a wedge pattern, creating a high supply zone for market participants. At the time of writing, Ethereum is trading at $1841 with gains nearly halved, implying that sellers are mounting a strong defense of this resistance. The long-wick rejection on the daily candle suggests a possibility of a bearish reversal.
In the event that overhead supply continues to stifle Ethereum’s growth, its price could adhere to the ongoing correction phase, driving the value down by 6.75% to reach the $1700 mark. A potential reversal from the $1870 resistance would create a new lower high in the ongoing correction phase for Ethereum’s price. Subsequently, this top could indicate the persistence of the prevailing downtrend, plunging the market value towards the critical $1700 support level found in the daily chart.
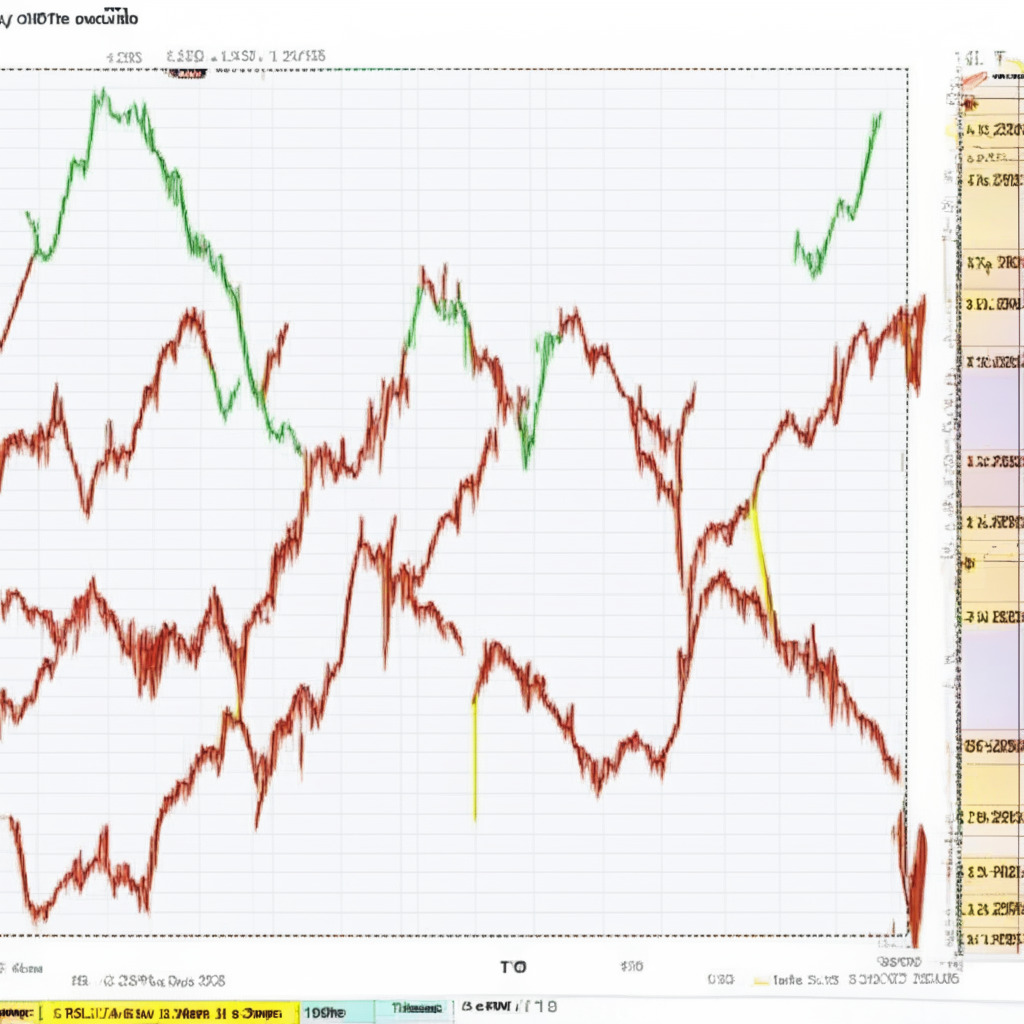
Focusing on pivot levels, the support/resistance indicator emphasizes the significance of the $1925 and $2087 supply zones. Conversely, buyers may encounter demand zones at $1700 and $1546, which could act as key areas of interest for price reversal.
The average directional index (ADX) offers a hint of bearish sentiment, with its downsloping trendline reflecting a lack of buyer conviction in Ethereum’s recent price uptick. This could point towards a higher probability of bearish reversal in the short term, though it’s essential to remain attentive to evolving market conditions. As always, conducting thorough research is crucial before investing in cryptocurrencies, and neither the author nor the publication will assume responsibility for any personal financial loss.
Source: Coingape