The crypto market has experienced noteworthy buying pressure in the last few days, possibly linked to the macroeconomic event of the US debt ceiling deal. Consequently, Bitcoin prices bounced back from a local support of $26,000 and surged 9% to hit the overhead trendline of the channel pattern. However, supply pressure at this resistance keeps Bitcoin prices under the threat of a prolonged correction.
The current short-term trend in Bitcoin price is bearish, as it resonates between two converging trendlines of the channel pattern. A red candle with long-wick rejection at the overhead trendline suggests a potential downfall in the Bitcoin price. The intraday trading volume in Bitcoin is $5.68 Billion, signifying a 12.5% loss.
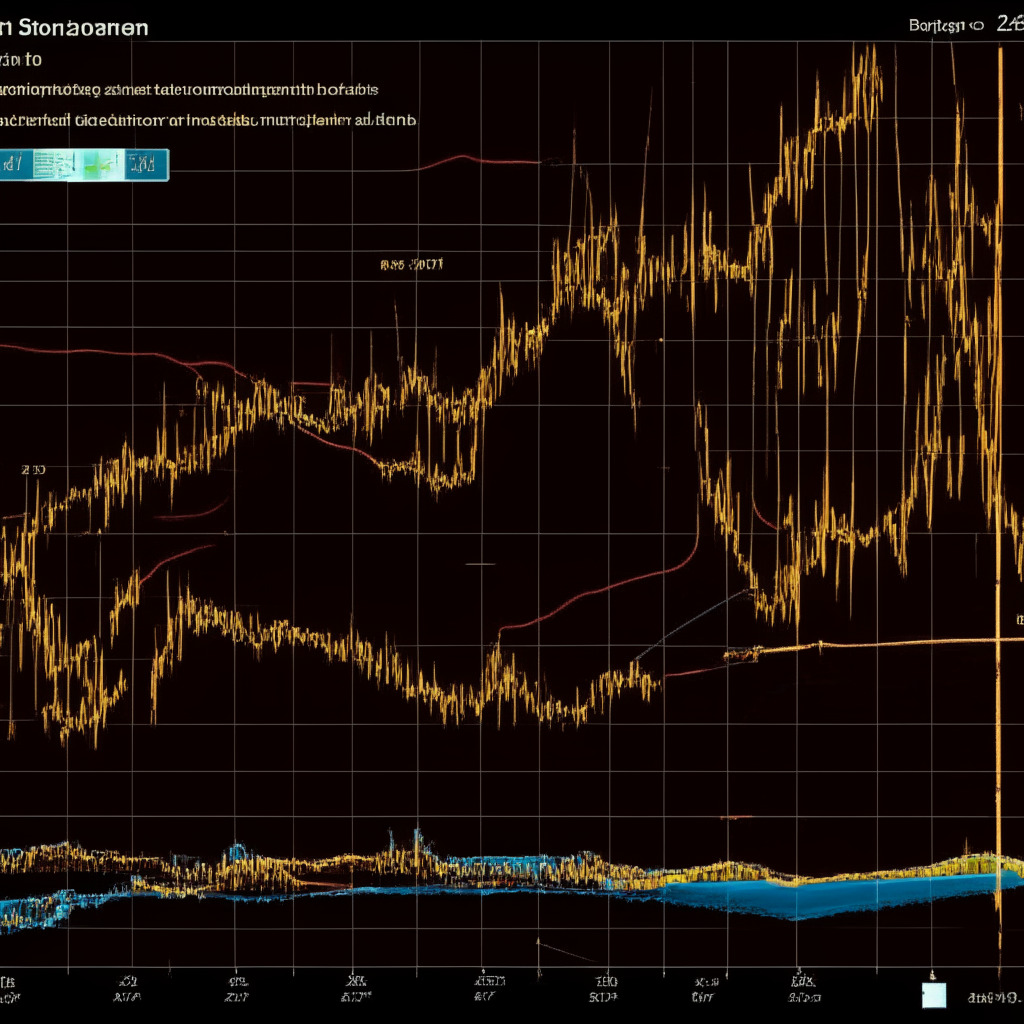
As of now, Bitcoin price trades at $27,762 with an intraday loss of 1.2%. This red candle is formed at the resistance trendline of the channel pattern, implying sellers still defend this resistance. Usually, a reversal from the above trendline replenishes the selling momentum and sets the asset price to fall back to the lower trendline. For this potential downfall, a flip below $27,500-$27,200 will offer additional confirmation for the resumption of the prevailing correction.
The post-breakdown may slide nearly 9% to hit the lower trendline of $25,000. In response to a reversal from the channel pattern’s resistance trendline, the Bitcoin price is poised for a downfall to the lower trendline, currently positioned at $25,000. Nonetheless, the potential fall could witness demand pressure at $27,500 and $26,000.
Coinciding factors show varying foreseeable outcomes. The 20-and-50-day Exponential Moving Averages (EMA) gathered near $27,500, establishing a strong support zone that may impede potential correction with the channel pattern. On the other hand, the Vortex Indicator reveals a bullish crossover between the VI+(blue) and VI-(orange), which reflects an overall positive market trend sentiment.
As with any market analysis, predicting the future price movement of cryptocurrencies comes with some degree of risk. Personal opinions may influence assessments, and market conditions can vary. Hence, thorough market research, due diligence, and a willingness to accept responsibility for any personal financial losses are essential for investors.
Overall, the Bitcoin market seems poised for potential downturns while still exhibiting signs of bullish sentiment. Both support zones and market trends will impact the Bitcoin price movement, keeping investors on their toes in navigating the uncertain market landscape.
Source: Coingape