
Customers of Hidden Road can soon access Crossover Markets’ crypto trading platform, helping institutions avoid conflicts of interest by separating trade execution from custody and brokerage services. The collaboration offers streamlined crypto trading but raises questions about liquidity and settlement times on an execution-only platform.
Search Results for: Crossover Markets

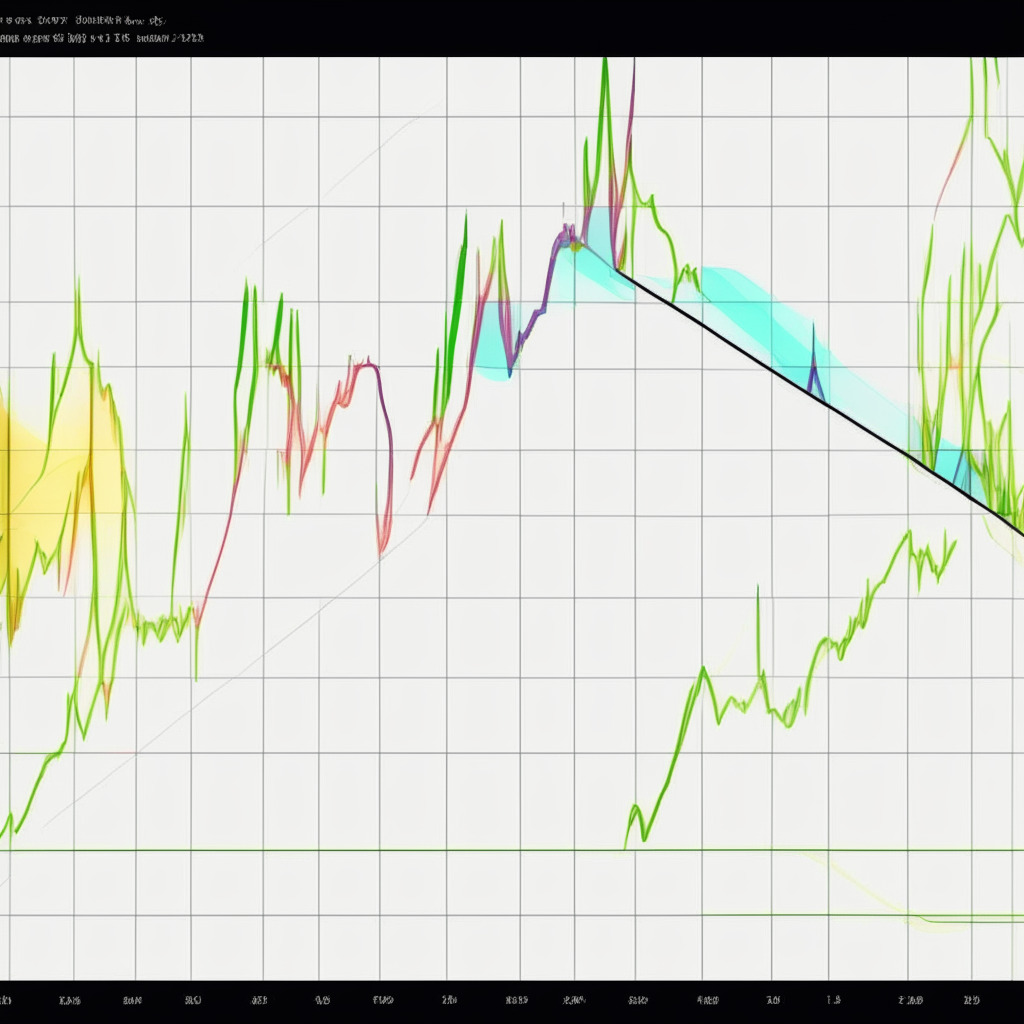
Terra Classic’s Bullish Comeback: Analyzing LUNC Price and Its Impact on Crypto Markets
The Terra Classic project sees a 2.57% rise with LUNC prices surging from $0.000086, hinting at a potential challenge to the resistance trendline. Increasing bullish momentum suggests a possible prolonged buying phase with a target of $0.0000994. However, investors should conduct thorough research as the likelihood of a breakout remains minimal.

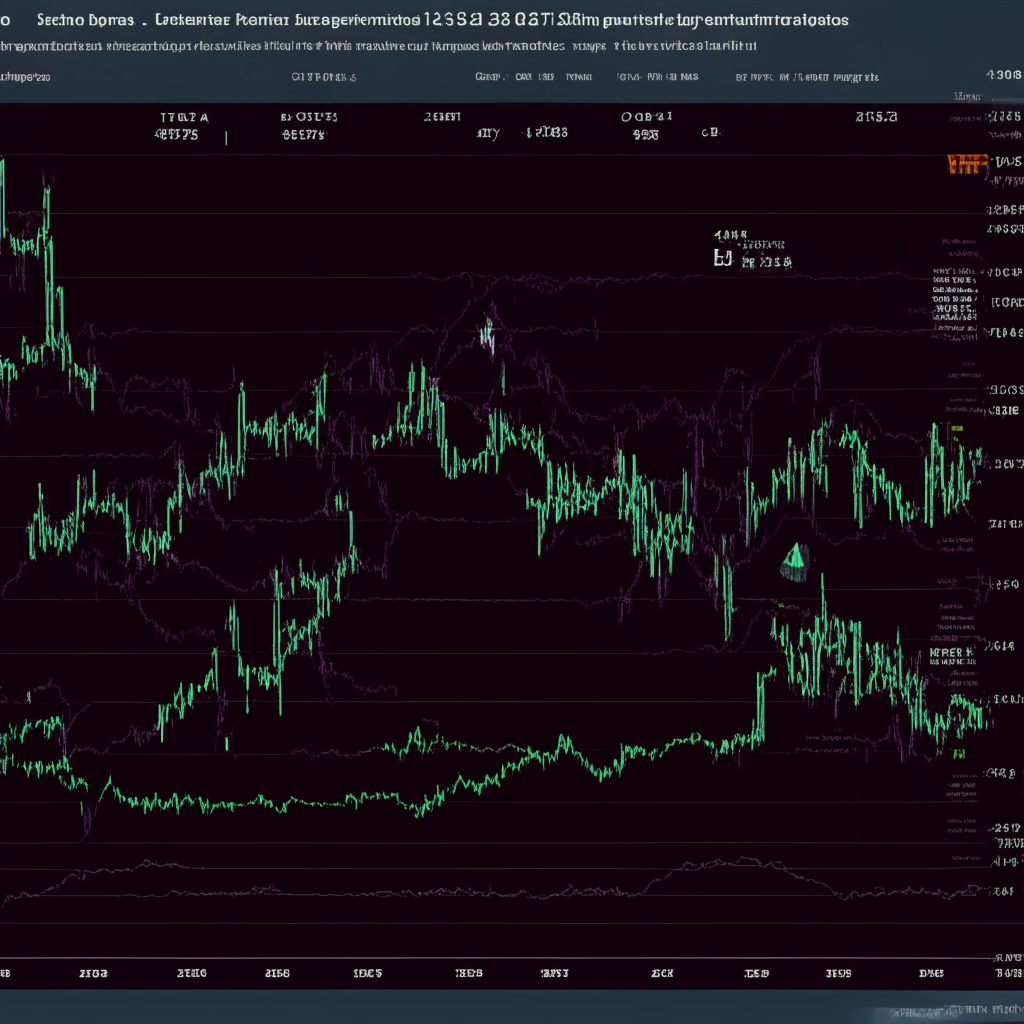
Banana Gun Token’s Volatility: AI Forecasting to the Rescue?
“BANANA coin’s roller-coaster trajectory incites uncertainty over its future. With the market not showing clear signs of being overbought or oversold, the predictability of BANANA’s price decay or ascension hangs in balance. Enter yPredict, a predictive AI platform that aims to improve market forecast accuracy.”

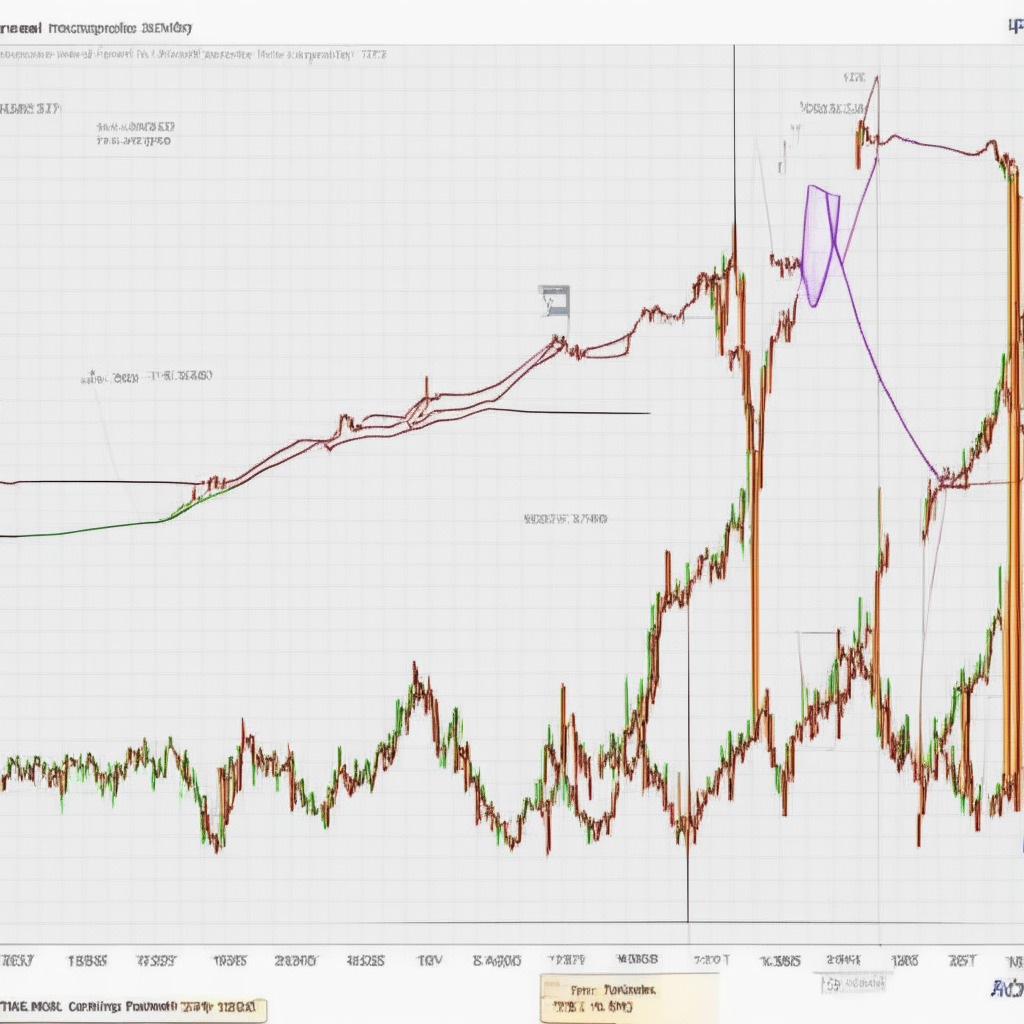
Bitcoin Defies Death Cross Predictions: A Tale of Resilience or Market Manipulation?
“BTC has surged 8% despite the looming ‘death cross’ indicating a potential downturn, suggesting resilience in the cryptocurrency’s value. The Federal Reserve’s probable unchanged rate also provides support to the Bitcoin boom. However, the future is unpredictable with shifting odds.”

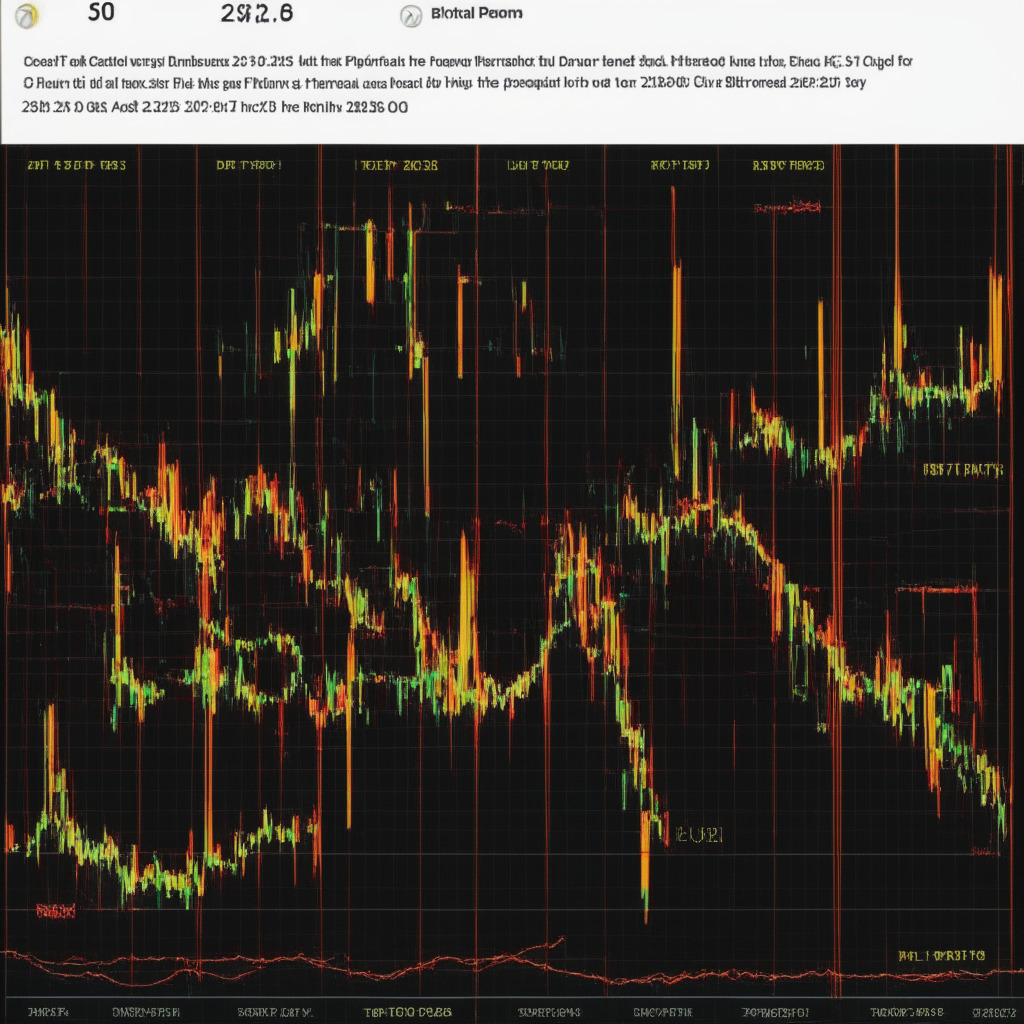
Navigating the Crypto Storm: FTX Fallout, Market Turbulence & Hidden Opportunities
“The cryptocurrency market faced increased volatility following revelations from FTX, a bankrupt crypto exchange with significant holdings. These developments sparked fears of potential asset liquidation flooding the market. Despite this turbulence, select producers, such as Wall Street Memes, Kaspa, Monero, Bitcoin BSC, and Bitcoin Cash, continue to show promising technical outlooks and robust fundamentals.”

South Korea’s Mirae Asset Securities Collabs with Polygon Labs to Tokenize Assets: Will this Disrupt the Traditional Financial Landscape?
Mirae Asset Securities collaborates with Polygon Labs to facilitate tokenization and Web3 integration with traditional finance. This alliance aims to create an infrastructure for issuing and transacting tokenized securities – translating tangible assets into blockchain-backed cryptographic tokens. The partnership anticipates reshaping capital markets by eliminating intermediaries, promising a more efficient, transparent, and inclusive global financial system.

Death Cross in Bitcoin’s Path: A Forecast of Decline or A Misleading Index?
The impending Bitcoin death cross, a bearish signal indicating short-term price momentum drop, could signify a market decline, strongly influenced by the strengthening U.S. dollar and perilous macro developments. Interestingly, Bitcoin’s death cross historically, hasn’t consistently yielded negative returns, poking holes in expectations of a straightforward decline.

Understanding the Implications of Bitcoin’s Overbought Downturn: A Comprehensive Analysis
“Fairlead Strategies predicts an “overbought downturn” for Bitcoin (BTC), hinting at decelerating upward momentum. This correlates with Bitcoin’s continuous inability to surpass the “cloud resistance” at approximately $31,900. Historically, similar downturns precede notable price peaks. Despite this, a long-term neutral bias is suggested by the MACD histogram.”

Navigating Bitcoin’s Turbulent Waters: ARK Invest’s AI Fusion Vision Vs ETF Approval Speculations
“Cathie Wood of ARK Invest predicts a future fusion of Bitcoin and AI, while former SEC Chairman, Jay Clayton, hints at a possible Bitcoin Exchange-Traded Fund approval. Amid market fluctuations, these developments contribute to positive crypto-enthusiast anticipation towards mainstream adoption of cryptocurrencies.”

Bitcoin Stumbles as Wall Street Memes Rise: Navigating the Crypto Rollercoaster
Bitcoin’s price fell over 5.5% following SEC’s delay on Bitcoin ETF application approvals. High volatility continues with emerging meme coins such as Shiba V Pepe (SHEPE) and Wall Street Memes (WSM). These developments evidence the evolving and high-risk nature of cryptocurrency investments.

Navigating Bitcoin’s Recent Dip: Analyzing Market Reactions and Future Predictions
Bitcoin sees a 4.6% retreat, stirring market interest in buying the dip. Its current circulating supply is nearing its capped total capacity. However, despite a bearish trend, If Bitcoin successfully breaks the $25,400 barrier, significant potential resistance may appear at $25,900 while a bullish crossover could aim towards $26,400 or $27,000.

Boost in Solana Trading With deBridge Launch: A Short-Lived Bull Run or Long-Term Magic?
“Solana traders see a significant uptick in activity with a 10% price surge attributed to the launch of deBridge, a protocol enhancing interoperability with Ethereum networks. Despite the surge, Solana’s future growth heavily relies on the adoption of this protocol.”
MATIC Price Recovery: Can Polygon Coin Surpass $0.75 Amid Market Sentiment Shift?
The MATIC price displays a steady uptrend with dynamic support to buyers, suggesting the potential to surpass the $0.75 mark. However, decreasing volume in its current recovery and possible selling pressure from overhead trendlines could impact this momentum. Technical indicators suggest a short-term buy signal, but market conditions remain subject to change.

Bitcoin’s 85% Rally: Analyzing Fairlead’s Neutral Stance and Future Market Predictions
Despite Bitcoin’s impressive 85% rally in H1 2023, Fairlead Strategies retains a long-term neutral outlook. A bullish bias will emerge once BTC surpasses the Ichimoku cloud resistance of $31,900 and receives momentum indicators’ support. This emphasizes the importance of continuous market monitoring and analysis for crypto enthusiasts and investors.
Ethereum’s Battle at $1926: Consolidation, Breakthroughs, and Key Indicators to Watch
Ethereum’s ongoing recovery rally encounters a roadblock at $1926, with sellers and buyers creating a narrow price range between $1867 and $1926. The overall market sentiment leans towards optimism, increasing the likelihood of breaking the $1926 resistance level and resuming Ethereum’s recovery. Traders should monitor key indicators like RSI and EMAs for informed decision-making.

Ethereum’s Struggle at $1939: Market Slowdown or Golden Buying Opportunity?
The crypto market has witnessed significant recovery, with Bitcoin gaining 15.65%. However, altcoins like Ethereum, which managed an 8.6% jump, face potential short-term slowdown as investors take profits. Ethereum currently struggles to surpass resistance at $1,939, hinting at a possible market reversal.

Crypto Recovery Cycle and the Rise of MATIC: The Perfect Time to Invest?
The recent recovery cycle in the crypto market, linked to major asset management companies’ interest in spot Bitcoin ETF, has greatly benefited MATIC’s price, with potential for a 12-15% rise before encountering significant resistance. However, consider possible minor pullbacks and overall market volatility before investing.

Dogecoin Price Rebound: Analyzing the Potential for a Bullish Future and Possible Resistance
The Dogecoin price rebounds, breaching the $0.0632 resistance mark due to increased investor interest and support from a positive market sentiment. Triggering a significant recovery, recent developments suggest a potential bull cycle and a possible bullish upswing as the price surges above the 20-day EMA.

BNB Coin’s Potential Upswing: Analyzing Technical Indicators and Market Sentiment
The recent BNB breakdown was anticipated to trigger further decline in the coin’s value. However, the improving bullish sentiment in the crypto market has brought about a minor consolidation phase, raising questions about the sellers’ ability to maintain lower levels. Binance Coin developments coincide with growing interest in the spot Bitcoin ETF, contributing to the bullish sentiment in the crypto ecosystem.

Shiba Inu Price: Support at $0.0000055 – Path to Recovery or Continuation of Downtrend?
The Shiba Inu price experienced a massive sell-off but recovered half of the day’s losses from the $0.00000555 support level. With increasing uncertainty in the crypto market, the Shiba Inu price may undergo a sideways trend or consolidation period. Key indicators to watch include the MACD and EMAs.
Ethereum Price Rally: Analyzing the Resistance Barrier and Potential Breakout Prospects
The Ethereum price recently experienced an 8.5% surge after encountering a crucial support level, reaching a resistance zone of $1775-$1765. However, selling pressure halted the rising momentum, suggesting possible consolidation before a significant recovery rally. JPMorgan recently backed Ethereum, despite some disagreements within the crypto community.

Dogecoin’s Stagnant Price: Analyzing the Future of DOGE Amid Uncertainty
Dogecoin’s price has remained stagnant below $0.063 resistance, with daily charts showing short-bodied candles and indecision among buyers and sellers. Traders are stabilizing price action after a plunge on June 10th, and a bullish breakout above $0.063 could hint at an upcoming relief rally. The 20-day EMA and converging DMI slopes may indicate a decline in bearish momentum.

Ethereum’s Dip: A Golden Trading Opportunity or Risky Business? Pros, Cons & Main Conflict
The Ethereum price recently retraced 23.5% to a long-anticipated support trendline, with decreasing volume hinting at a possible bullish reversal. Accumulation at the critical trendline and a weekly long-tail hammer candle suggest a higher likelihood of a bullish reversal. However, investors should conduct thorough research before investing, as market conditions are subject to change.

Bitcoin’s Battle at $25,000: Can it Climb Back to the $30K Range?
The Bitcoin price found support at $25,000, sparking a 7% increase in market value within three days. The current decline follows a falling wedge pattern, and a breakout could indicate a resumption of recovery, potentially propelling the price to reach $30,000. Market sentiment during the second half of June may also influence price trajectories.
Binance Coin Breakout: Analyzing the Downward Trend and Future of BNB Blockchain
The Binance coin price experienced a decisive breakout, unleashing trapped bearish momentum and setting BNB on a potential prolonged downturn. With the $200 mark as a high-demand zone, a bearish EMA crossover might trigger additional sell orders. Binance’s BNB Chain approaches a layer 2 blockchain solution announcement.

Ethereum Downturn: Will Buyers Initiate a Recovery Rally or Face Further Decline?
Ethereum experienced a 15% decline in market value in June, reaching a low of $1624.65. However, it found support along a trendline that has been crucial for maintaining its price uptrend. The falling price may present opportunities for buyers if maintained above the trendline, with prospects for recovering past $2140 peak. The future trajectory remains uncertain, so thorough market research is vital.

BNB’s Struggle: Analyzing the 28.5% Drop Amid Binance’s Legal Woes and Altcoin Crash
BNB’s value experienced a 28.5% drop amid Binance’s legal dispute and recent altcoin crash, breaking a symmetrical triangle pattern suggesting a continued downward trajectory. With selling pressure intensifying, BNB’s price might decline to $182.5, putting it at significant risk for further decrease.
XRP Defies SEC Crackdown: Double Bottom Pattern Signals Potential Bull Run
The XRP price demonstrates a bullish outlook despite the SEC crackdown, sustaining higher levels and showing a sharp reversal at the crucial $0.486 level. The double bottom pattern in the daily chart indicates strong buyer accumulation, offering potential for a breakout above $0.55 resistance and pushing the price above $0.6. Market sentiment remains bullish with increased trading volume and supportive EMA and vortex indicator trends.

Bearish MACD Signal: Will Bitcoin’s Future Rely on US Inflation and Fed Rate Decisions?
The moving average convergence divergence (MACD) histogram recently crossed below zero on Bitcoin’s weekly chart, indicating a potential shift from bullish to bearish market conditions. However, the upcoming U.S. inflation report and Federal Reserve decision could significantly influence Bitcoin’s price, with some analysts remaining optimistic about support levels near $25,200.

Ethereum Price Plummets: Analyzing Support Levels and Bearish Sentiments for Investors
Ethereum’s price breakdown on June 10th caused it to fall below the $1775-$1764 support zone, intensifying selling pressure and extending its bearish phase. The $1700 horizontal support and angular trendline may act as accumulation zones to offset further decline, while a growing bearish sentiment among traders is indicated by the directional movement index and exponential moving average.
Binance Coin: Navigating Legal Woes, Triangle Pattern & Potential 20% Growth Opportunity
Binance Coin (BNB) faces selling pressure as the SEC takes legal action against the crypto exchange, causing a 17.5% drop in market value. However, the support level aligns with the triangle pattern’s trendline, signaling potential accumulation and a possible bullish reversal. Watch for market conditions and conduct thorough research before investing.

Navigating the Crypto Tug-of-War: Wedge Pattern, Market Shifts, and Future Projections
The crypto market experiences a tug-of-war between buyers and sellers, with Bitcoin’s short-term downtrend in force and potential for consolidation. A falling wedge pattern signals price drop before significant upswing, but a bullish recovery requires a breakout beyond the overhead resistance trendline. Conduct personal research for investment decisions.